Full trucks don’t guarantee full utilization. They guarantee activity, which is a different thing entirely.
When capacity planning fails to account for real constraints like driver hours, appointment windows, dwell time, and lane patterns, the schedule looks executable until it isn’t. Gaps surface mid-week. Routes collapse late in the day. Spot coverage absorbs margin nobody budgeted for.
The problem is rarely a truck shortage. It’s a planning gap. CIGO Tracker is built around closing that gap early, before dispatch inherits a plan that was already overcompromised.
Key Takeaways
- Capacity planning turns fleet availability into clear, enforceable supply so you stop guessing and start committing with confidence.
- Capacity planning software reduces empty miles by aligning demand, lanes, and equipment constraints earlier in the planning cycle.
- Better planning improves utilization without burning drivers out, because it protects hours-of-service limits and builds in realistic buffers.
- The biggest savings usually show up in fewer reattempts, fewer last-minute spot buys, and lower cost per stop over time.
- Strong KPI tracking connects planning decisions to service outcomes and true operating cost, so the model improves instead of repeating the same mistakes.
What Is Capacity Planning?
Capacity planning is the process of forecasting demand and matching it to available resources before commitments are made. Straightforward in concept. Genuinely difficult to sustain in real operations.
The challenge is that capacity is not one number.
As IGPS Network’s supply chain analysis notes, effective capacity planning requires accounting for equipment, facilities, and time windows together, not independently. In fleet terms, that means hours-of-service limits by driver and day, trailer types and their physical constraints, appointment windows at both pickup and delivery, realistic dwell time per stop type, and deadhead patterns by lane.
When a plan treats any of those as unlimited, the schedule looks workable on paper and falls apart in the field. Capacity planning software makes those constraints visible and enforceable before work gets confirmed.
Capacity Planning vs. Route Planning
The two disciplines work in sequence and are easy to conflate.
Capacity planning answers the earlier question: do we have enough supply, and where? Route planning comes after, optimizing the sequence once you know the work fits inside the available day.
Skip capacity planning and go straight to routing, and you’re sequencing work that may not fit. The route looks clean. The execution doesn’t. That’s where overtime, missed windows, and late-day collapses come from.
| Capacity Planning | Route Planning | |
| When it happens | Before commitments are made | After capacity is confirmed |
| Core question | Do we have enough, and where? | What’s the most efficient sequence? |
| What it manages | Drivers, equipments, lanes, time windows | Stop order, mileage, ETAs |
| Failure mode | Overpromised schedules | Optimized routes that still collapse |
Capacity Planning vs. Dispatching
The two functions serve different purposes. Capacity planning eliminates problems before they reach operations.
Dispatching manages what slips through, like breakdowns, last-minute customer changes, and weather delays. When capacity planning is weak, those two roles blur. Dispatch ends up solving problems that should have been caught earlier, which leaves less room to handle the disruptions no one could have predicted.
Fix the planning layer, and dispatch gets its job back.
Why Fleet Utilization Breaks Down (Even When You Have Trucks)
Most utilization problems are not a shortage of trucks. They’re a mismatch between supply and demand across time, lane, and equipment type. Total volume might look manageable. The detail often doesn’t.
According to ATRI’s 2025 operational cost research, empty miles averaged 16.7% across U.S. truckload carriers in 2024, with operating costs at $2.26 per mile. That means a significant share of every dollar spent running a truck generates no revenue. Better capacity alignment is the most direct lever for closing that gap.
Small planning misses stack quickly. A single route running 45 minutes long ripples into the next stop, pushes a dock appointment, triggers a missed window, and forces a reattempt. Multiply that across several lanes and the weekly cost picture shifts significantly.
The Common Utilization Leaks
Four patterns compound quietly across the week and account for most fleet margin loss.
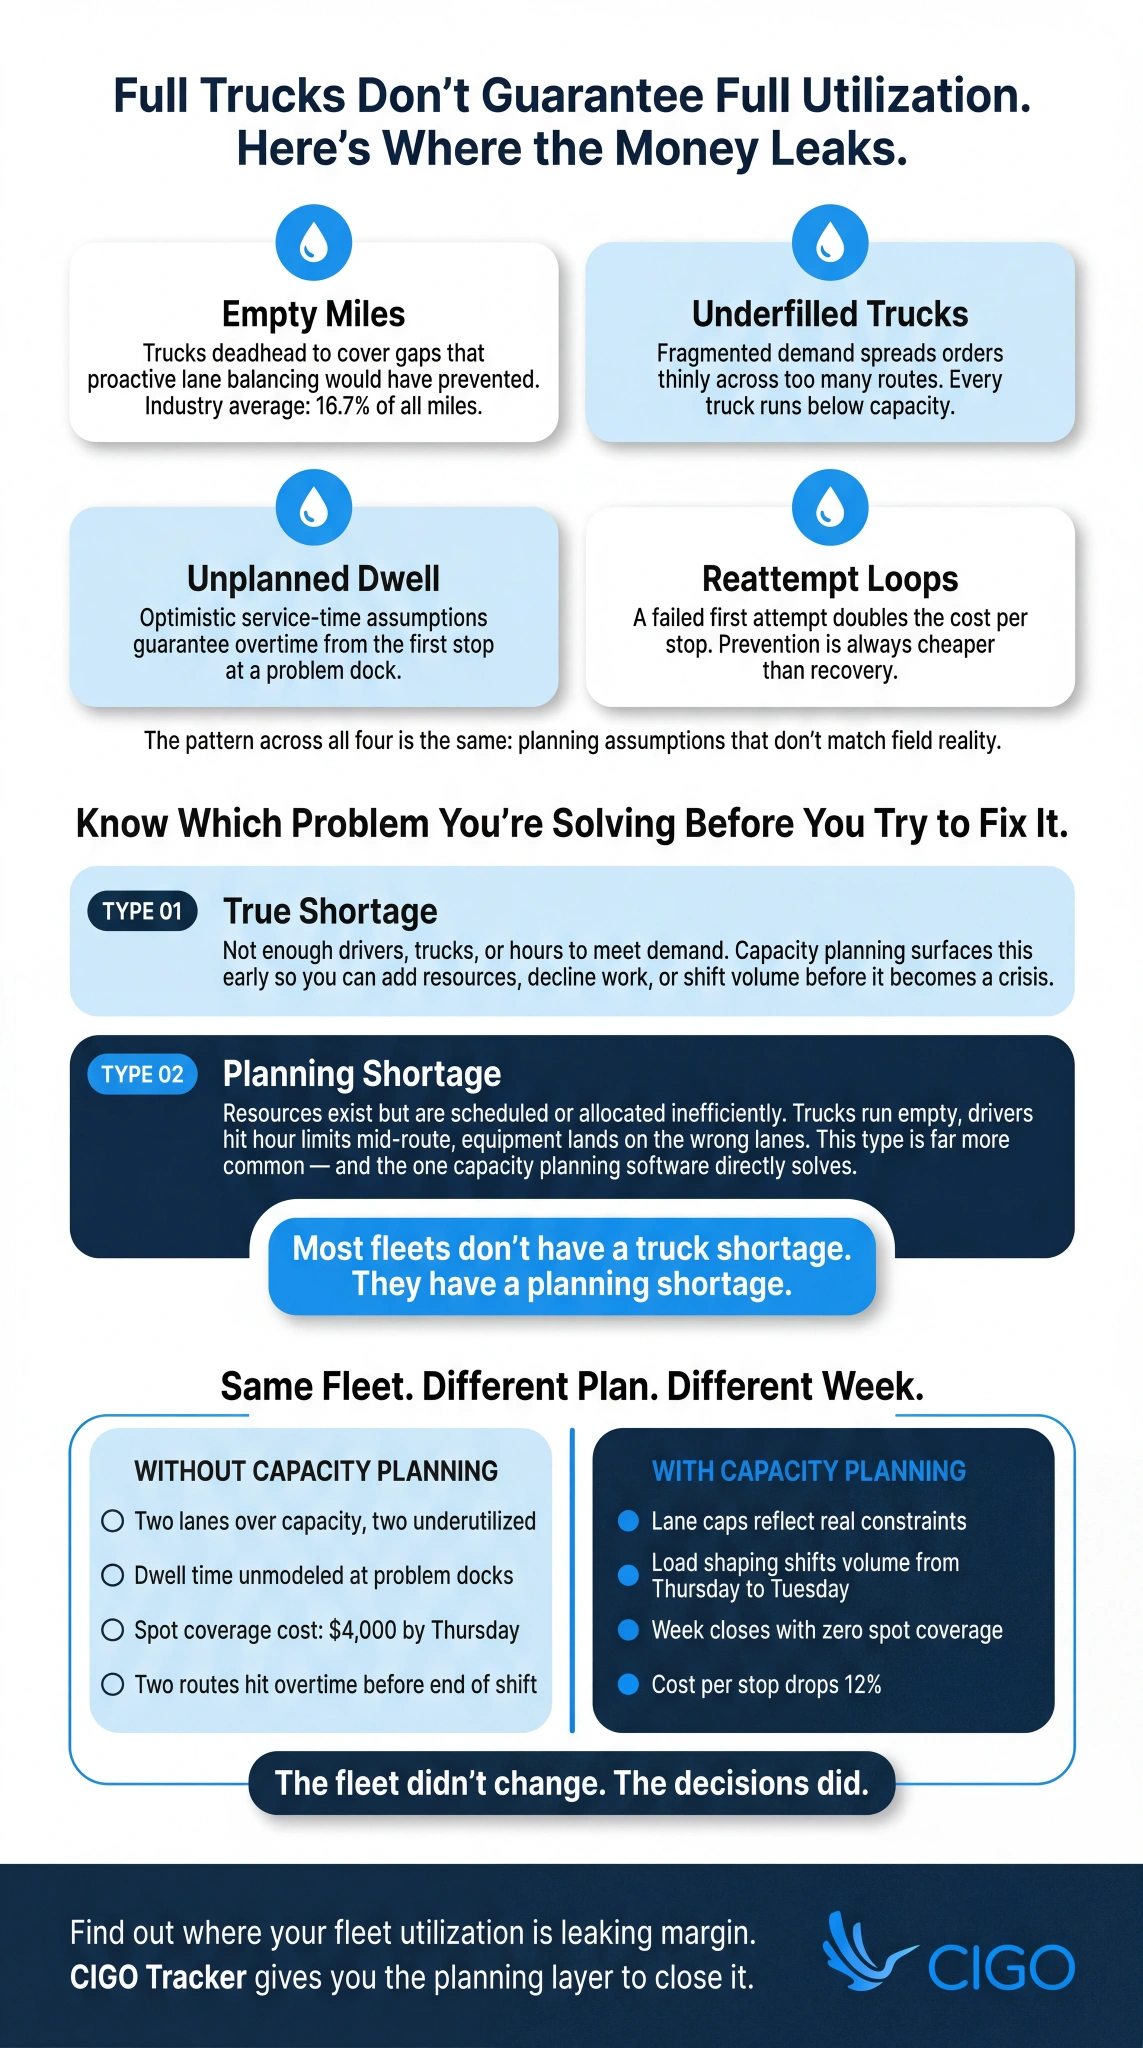
- Empty miles from poor lane balance. When demand isn’t spread intentionally, trucks deadhead to cover gaps that proactive allocation would have prevented.
- Underfilled trucks from fragmented demand. When orders are spread thinly across too many routes and days, trucks run below capacity on every trip. Load shaping consolidates that demand into fuller, more efficient runs.
- Unplanned dwell time. When service time assumptions don’t reflect actual conditions at recurring problem docks, overtime is nearly guaranteed from the start.
- Reattempt loops. A failed first attempt typically doubles the cost per stop. Preventing it requires better planning inputs, not faster recovery.
The pattern across all four is the same: planning assumptions that don’t match field reality.
The Two Types of Not Enough Capacity
Understanding which type you’re dealing with matters because the solutions are different.
- True shortage means not enough drivers, trucks, or hours to meet demand. Capacity planning surfaces this early, giving you time to add resources, decline work, or shift volume before it becomes a crisis.
- Planning shortage means the resources exist but are scheduled or allocated inefficiently. Trucks run empty, drivers hit hour limits with routes unfinished, and equipment lands on the wrong lanes. This type is far more common, and it’s the one capacity planning software directly solves.
How Capacity Planning Software Improves Utilization
The core promise of capacity planning software is turning availability into a planning model that guides decisions before costs get locked in. That happens through three connected capabilities: seeing constraints early, planning lanes intentionally, and protecting buffers for variability.
Without software, those three things live in spreadsheets and tribal knowledge.
The plan is only as current as the last manual update. With software, the capacity picture is live, shared, and enforceable by everyone working from it.
Demand Forecasting That Is Usable for Operations
Useful demand forecasting breaks volume down by day, lane, customer segment, and equipment type. Critically, it separates likely volume from committed volume.
Inbound Logistics’ capacity planning research points out that historical data analysis is the foundation of any capacity planning process, specifically because it reveals patterns in utilization that aggregate volume numbers hide. Total weekly volume tells you very little.
Consistently overloaded lanes on Tuesdays and Thursdays tell you exactly where to act.
That separation matters because it lets planners hold back capacity for variability instead of booking everything out and hoping the day holds together.
Capacity Modeling That Reflects Reality
A capacity model that only counts trucks misses most of what limits execution.
The model needs to include driver hours, trailer type constraints, dock appointment windows, realistic dwell time, and lane-level deadhead patterns. Teams using route scheduling software for daily ops already have the service-time data that makes this modeling accurate rather than generic.
The practical output is a lane-level capacity calendar. Each lane has a defined cap by day and equipment type, so new demand is checked against what’s actually available.
Smarter Allocation and Load Shaping
Once constraints are modeled, the software guides allocation intentionally. Priority lanes and customers claim capacity first, and secondary work fills in around them rather than competing for the same slots.
Where flexibility exists, work gets pulled forward or pushed back to smooth peaks before a single heavy day breaks multiple routes.
Buffers then protect against variability without sacrificing commitments. A lane running at 85% isn’t underutilized. That remaining 15% is what keeps one late dock from cascading into late routes everywhere.
Earlier Exception Signals
The most valuable moment to catch a problem is before you commit. Capacity planning software flags overload risk before a load is accepted, highlights lanes trending toward coverage gaps, and surfaces high-risk docks based on historical dwell patterns.
Those signals only matter if they arrive early enough to act on. Operations already relying on delivery dispatch software for exception workflows get the added advantage of bridging planning alerts directly into day-of response.
Cost Reduction: Where the Savings Actually Come From

Capacity planning savings are not abstract efficiency gains.
They come from specific, preventable costs that planning decisions either create or eliminate. Understanding where the money goes makes the ROI concrete.
The Biggest Cost Buckets Capacity Planning Can Reduce
- Spot coverage and premium labor. When a capacity gap surfaces at dispatch rather than during planning, the only option left is expensive. Short-notice spot rates carry a significant premium over contracted rates, and that gap compounds quickly across lanes.
- Empty miles from mismatched lanes. Proactive lane balancing during planning reduces the repositioning that happens when trucks finish routes far from where the next load starts.
- Overtime from underestimated routes. When dwell time assumptions don’t reflect actual stop conditions, shift hours are consistently underestimated from the start. Fixing the planning input is what reduces overtime, not adding drivers.
- Reattempt loops. A meaningful share of first delivery attempts fail in practice, creating additional return trips that double the cost per stop. Prevention through better scheduling is always cheaper than recovery.
Scenario: Same Fleet, Different Plan
Week A runs on reactive planning. Loads arrive and get accepted. Dwell time goes unmodeled. Two lanes run over capacity while two others sit underutilized. By Thursday, dispatch is scrambling, spot coverage costs $4,000, and two routes hit overtime.
Week B uses the same fleet with capacity planning software. Lane caps reflect real constraints, load shaping shifts volume from Thursday into Tuesday, and problem docks have accurate service times built in. The week closes without spot coverage and cost per stop drops 12%.
The fleet didn’t change. The decisions did.
Key Features to Look For in Capacity Planning Software
The right platform enforces planning discipline before costs get locked in. Look for:
- Lane and day capacity calendars with configurable buffers by equipment type
- Forecasting with planner overrides so judgment stays in the model
- Constraint logic covering hours-of-service, dwell time, and appointment windows
- Approval workflows and audit trails for above-capacity requests
- Early alert logic for overload risk and recurring bottlenecks
- Reporting that connects planning inputs to cost outcomes over time
- Integrations that keep the capacity plan current without manual updates
Feature evaluation gets you halfway there. The other half is understanding how a new tool fits into your existing data flow and tech stack, which is a separate set of questions to ask before integrating logistics software.
What Data You Need to Get Value Fast
Capacity planning software is only as accurate as the data feeding it. The priority before rollout is honest data, not perfect data.
Start with historical demand by lane and day, including actual service times rather than planned ones. Planned times inherit the same optimism that created your current problems. From there, document real fleet availability and dwell time at recurring problem facilities.
Teams already tracking last-mile delivery performance KPIs have a ready-made baseline to measure the planning model against from day one.
Keep the Model Honest
Use ranges and buffers rather than single-point service-time assumptions. A stop that takes between 20 and 45 minutes depending on the facility should reflect that variability, not collapse into an average that’s wrong in both directions.
Track overrides consistently, too. When reasons are documented, patterns surface quickly: which lanes are chronically over-allocated and where the model needs recalibration.
Understanding why fleet routing software decisions diverge from actual outcomes is the calibration loop that makes capacity models improve over time.
Best-Fit Use Cases
Private Fleets and Dedicated Operations
Private fleets feel utilization problems acutely because every underused asset carries a fixed cost with no revenue to offset it. Capacity planning helps close that gap without sacrificing the service windows that define their value. Specifically, it delivers:
- Lane-level balancing to reduce empty repositioning miles
- Earlier exception signals so overtime is caught in planning, not at dispatch
Pairing capacity planning with strong fleet management and dispatch tools creates the end-to-end control needed to keep utilization high and costs predictable.
Last-Mile Delivery Fleets
Last-mile fleets face a specific utilization problem: stop capacity looks fine in the morning and collapses in the afternoon.
That pattern almost always traces back to unmodeled dwell time and stop sequences that ignored real access conditions. Capacity planning prevents late-route collapse by building service-time variability into the model before routes are confirmed.
Smart route sequencing connects directly to those planning inputs, turning well-built plans into routes that hold through the full shift.
3PLs Managing Capacity Across Customers
For 3PLs, the core risk is allocating the same truck to two customers because account managers are working from separate availability views.
A shared allocation layer prevents that kind of silent double-booking.
Approval workflows then ensure above-cap exceptions are visible and intentional. Integrations for 3PLs and multi-customer retail operations are worth evaluating alongside the capacity planning layer, since the plan is only reliable when it stays in sync with each client’s order stream.
Implementation Best Practices

Operations that get the most from capacity planning software define success metrics before they go live. From there, three practices separate clean rollouts from messy ones:
- Start with one region or lane family, not the entire network
- Set caps, buffers, and cutoffs before the system enforces them
- Build a weekly rhythm around forecast review, allocation, and exception identification
Change management determines whether the software sticks. Teams route around systems they don’t understand, so training on when to override, who approves, and how decisions get documented is what makes the rest work.
Common Mistakes to Avoid
Three patterns consistently undermine rollouts that should have worked.
- Treating capacity as truck count only. A truck assigned to a route it cannot complete within available shift hours is not contributing capacity. It’s a contributing risk.
- Allowing unlimited overrides. Without a documented reason and named approver, exceptions quietly recreate the spreadsheet problem inside a more expensive tool.
- Measuring utilization without tracking reattempt costs. High utilization paired with high reattempt rates means trucks are running hard while recovery spending climbs alongside them. The two metrics belong together.
KPIs to Track After Rollout
The KPIs that matter most tie planning decisions to financial outcomes. Teams already using fleet manager KPI tracking frameworks have a head start on setting the baseline before go-live.
- Utilization rate across trucks, driver hours, and equipment type
- Empty miles and deadhead percentage, benchmarked against the FreightWaves industry range of 15 to 20%
- Cost per stop, tracked week over week rather than as a one-time snapshot
- Overtime hours, which signal service-time assumptions that need recalibration
- On-time performance against promised windows
- Reattempt rate categorized by failure reason
- Override frequency, the leading indicator that caps or approval culture need attention
How CIGO Tracker Supports Better Capacity Planning Outcomes
CIGO Tracker is built around execution visibility that validates planning assumptions rather than just reporting on outcomes.
Through delivery tracking, the Planner, and logistics optimization tools, planners get a live view of the gap between plan and execution, which is where capacity model calibration actually happens. SOC 2-compliant security keeps that data protected throughout.
Consistent proof capture and exception reason codes then close the feedback loop, so capacity assumptions tighten over time based on what actually happens on the road.
Future Trends in Capacity Planning Software
Capacity planning software is moving toward probabilistic constraint modeling, where platforms work with stop-time distributions rather than averages, because averages conceal the variability that causes plans to fail.
Gartner predicts that 70% of large organizations will adopt AI-based supply chain forecasting by 2030, underscoring how decisively the industry is moving away from static, average-based models. Automated lane balancing, tighter execution feedback loops, and governance features like audit trails and tiered permissions follow naturally from that shift.
The practical lesson is that better capacity planning is not about more data alone; it is about building systems that act on what the data reveals before the window to respond closes.
Is Your Capacity Plan Honest Enough to Hold Under Pressure?

Utilization improves when demand is matched to real constraints early and the plan is protected with caps and buffers that hold. Identify your biggest utilization leaks, set baseline KPIs before go-live, and pilot on the lanes where overload happens most.
You do not need a perfect model. You need an honest one. Start a free trial or contact the CIGO Tracker team to get started.
FAQs
What is capacity planning, and how is it different from routing?
Capacity planning forecasts demand and matches it to available trucks, drivers, and appointment windows before commitments are locked in. Routing optimizes stop sequences after. Skipping capacity planning and jumping straight to routing means you are sequencing work that may not fit the shift.
How does capacity planning software improve fleet utilization?
Capacity planning software makes availability visible at the lane and day level. Empty miles drop when lanes are balanced proactively, underfilled trucks become rarer with load shaping, and overtime decreases when service-time assumptions reflect actual dwell rather than best-case scenarios.
Which KPI best proves cost savings from capacity planning?
Cost per stop, tracked week over week, captures the combined effect of utilization improvements, reattempt reductions, and overtime control in one number finance can validate. Read alongside on-time delivery performance and reattempt rate, it gives the clearest signal that your capacity model is working.
What data do you need to implement capacity planning software?
You need historical demand by lane and day, actual service times, current fleet availability, and exception reasons from recent operations. The most common gap is not missing data but inaccurate data, specifically service times based on targets rather than actuals.
How long does it take to see measurable improvements?
Most operations see measurable impact within four to six weeks when capacity calendars and booking caps are implemented on priority lanes first. Override frequency and spot buy rate move first; cost per stop and overtime reductions follow as the planning rhythm stabilizes.