Route optimization gets most of the credit. But even fleets running sophisticated algorithms still find the same zones chronically overfull while adjacent ones move half-empty trucks through the day.
The problem is structural, not algorithmic. Zone-based delivery planning is the layer those algorithms depend on, and most fleets treat it as a one-time setup rather than an active management decision.
CIGO Tracker helps fleets fix that gap by treating zone boundaries as an active management decision, not a one-time configuration.
Key Takeaways
- Delivery zone management divides a service area into geographic units, each with its own demand profile, capacity limits, and routing rules.
- Intelligent zoning last mile planning matches zone size and shape to real stop density, driver hours, and vehicle capacity rather than administrative boundaries.
- Poorly designed zones are a common hidden cause of high cost-per-stop, driver overtime, and underutilised fleet capacity.
- Redesigning zones around demand density improves route efficiency delivery outcomes without adding vehicles or drivers.
- Zone-based delivery planning divides a service area into geographic units, each with its own demand profile, capacity limits, and routing rules.
What Is Zone-Based Delivery Planning?
Zone-based delivery planning divides a service area into geographic segments, then manages capacity, routing, and driver allocation separately for each one.
Each zone carries its own stop density ceiling, vehicle type assignment, and driver constraints. Those parameters are what give the routing algorithm something accurate to work with.
Without well-designed zones, even the best routing software sequences stops that the fleet cannot realistically execute. Zone design is what determines whether a route is buildable before it ever reaches dispatch.
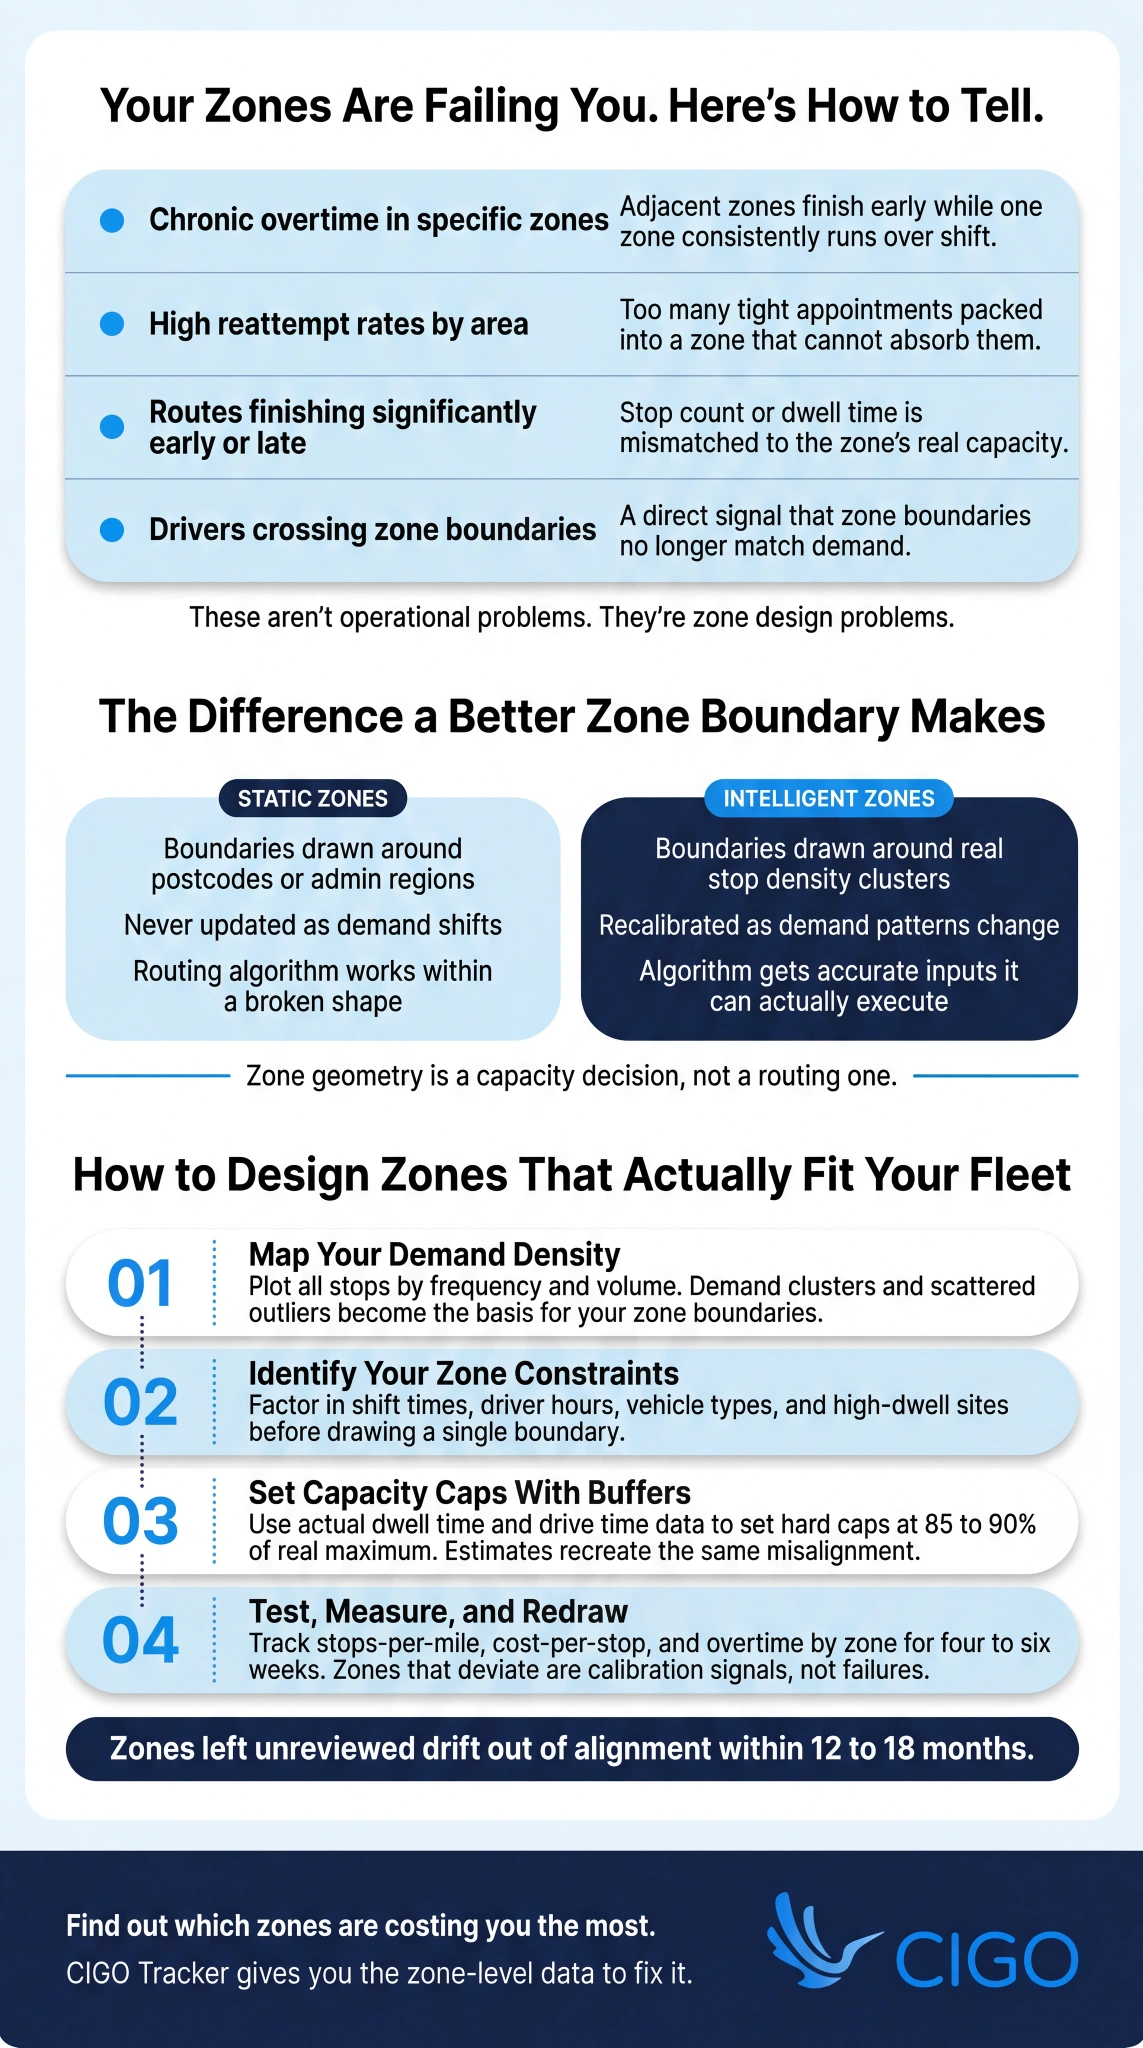
Static Zones vs. Intelligent Zones
| Static Zones | Intelligent Zones | |
| Boundaries | Fixed at deployment | Calibrate to real demand patterns |
| Basis | Postcodes or administrative regions | Stop density, service time, and vehicle capacity |
| Response to demand shifts | None | Adjust as demand shifts |
| Routing Impact | Wrong-shaped zones limit algorithm performance | Accurate inputs produce executable routes |
How Delivery Zone Design Affects Capacity
Zone geometry is a capacity decision, even when planners treat it as a routing one.
Draw a zone too large and inter-stop drive times grow, which compresses stops-per-hour and pushes cost-per-stop higher. Draw it too small and the assigned driver and vehicle finish underutilised. Similarly, cutting boundaries across natural demand clusters adds unnecessary cross-zone travel that no routing algorithm can eliminate.
Each of these outcomes traces back to the same root cause: a zone that was never sized for the demand it actually carries.
Why Poorly Designed Zones Kill Route Efficiency
Routing software sequences stops within a zone efficiently. What it cannot do is fix a zone that was never shaped for the demand it carries.
Most fleets inherit zone structures from an earlier, lower-volume state of the business and never revisit them. As volume grows and demand shifts, those boundaries quietly fall out of alignment with reality.
That gap is where efficiency bleeds out. Route optimisation in last-mile delivery can only recover so much performance within a broken zone boundary.
The Signs Your Zones Need Redesigning
- Chronic overtime in specific zones while adjacent zones finish early: a demand imbalance visible in any driver timesheet.
- Consistently high reattempt rates in certain areas, often from too many tight appointments stacked into a zone that cannot absorb them.
- Routes finishing significantly early or late in the same zones: a reliable indicator of stop-count or dwell-time mismatch baked into the zone design.
- Cross-zone routing, where drivers leave their assigned zone to cover nearby stops: a direct boundary misalignment signal.
How Misaligned Zones Create False Capacity
A zone capped at 30 stops appears manageable on paper. In practice, if 10 of those stops carry 30-minute dwell times, real executable capacity is closer to 20.
That gap between visible and actual capacity is where false confidence builds. Failed deliveries cost retailers $17.78 each, according to Retail Touchpoints, a figure that compounds quickly when zone design produces stop counts the fleet cannot realistically execute.
Over-consolidated zones make this worse by concentrating demand risk, so one driver call-out exposes an entire area.
How Intelligent Zoning Improves Delivery Capacity
Intelligent zoning increases real capacity by aligning each zone’s size, shape, and stop limits with what drivers and vehicles can actually execute within a shift.
The practical outcome is straightforward: more stops per driver-hour and fewer miles per stop.
A significant portion of delivery time is spent at the stop itself, between parking, access, and handoff. Zone design directly controls how many of those stops a driver can realistically reach and complete in a day.
Better-shaped zones reduce wasted movement and produce more consistent execution across the entire fleet.
Stop Density Optimisation by Zone
Start by mapping actual stop locations against delivery frequency to identify where demand clusters naturally form, then draw zone boundaries around those clusters rather than around postcodes or administrative lines.
From there, set target ranges for each zone type:
- Urban dense: higher stops-per-mile, shorter drive time between stops
- Suburban: balanced stop count with longer access windows
- Rural: wider geographic coverage with adjusted dwell allowances
Temporal batching, grouping stops by delivery frequency, increases route density without expanding the geographic footprint.
Zone-Level Capacity Calendars and Booking Controls
Each zone needs a maximum daily stop count grounded in realistic dwell time, driver hours, and vehicle payload.
Without that figure, intake teams have no reference point when accepting orders.
Zone-level capacity calendars make available slots visible at booking, which lets intake manage expectations before overcommitment occurs.
Dynamic Zone Adjustment as Demand Shifts
Seasonal demand shifts should trigger zone boundary reviews, not just temporary capacity additions. Adding stops to a misaligned zone compounds the underlying problem rather than solving it.
New customers clustering near zone edges are a reliable signal that a boundary redraw is overdue.
Rather than waiting for complaints, use zone performance data to catch the problem early. When cost-per-stop climbs, overtime rates rise, or on-time rates slip consistently in a specific zone, the zone no longer fits the demand it carries.
How to Plan Delivery Zones: A Step-by-Step Framework

Zone-based delivery planning follows a four-step cycle: mapping demand, constrained by operational reality, setting caps, and measuring against performance data.
Step 1: Map Your Current Demand Density
Before redesigning anything, plot all delivery stops by frequency and volume. Demand clusters and scattered outliers become immediately visible, and that separation is where your redesign starts.
Separate stop types with materially different service times, residential versus commercial, standard versus liftgate. Your zones with the highest cost-per-stop are priority candidates.
That is where the gap between zone design and actual demand is costing you the most.
Step 2: Identify Your Zone Constraints
Zone size must reflect operational reality, not geographic convenience. Analysing how your drivers perform across the fleet reveals the inputs that matter most: shift times, driver count by day, and hours-of-service windows.
Vehicle type requirements then determine which zones need liftgate, reefer, or oversized access. High-dwell sites and parking-limited areas need smaller stop caps than their geographic footprint suggests.
Step 3: Set Your Zone-Level Capacity Caps and Buffers
Use actual dwell time and inter-stop drive time from your historical route data to calculate the real maximum stops per zone. Estimates will create the same misalignment you are trying to fix.
Set hard caps at 85% to 90% of that maximum. A 70% threshold triggers a review flag; 90% triggers a booking hold, giving planners lead time before you hit the ceiling.
Step 4: Test, Measure, and Redraw
Four to six weeks of live data tells you more than any model. Track stops-per-mile, cost-per-stop, overtime rate, and reattempt rate by zone, and compare against your baseline.
Zones that deviate from projections are not failures. They are calibration signals telling you where the design still needs refinement. Schedule a quarterly review because demand shifts continuously, and zones left unreviewed will quietly drift out of alignment.
Key Features of Zone-Based Delivery Planning Software
Separating genuine zone management from a relabelled routing tool requires a specific checklist:
- Geographic zone builder: draw and edit zone polygons from demand heat maps, not postcode or administrative boundaries.
- Zone-level capacity calendars: stop caps by zone, day, equipment type, and driver with configurable buffers.
- Demand heat mapping: visualise order density by zone, day, and stop type to support zone-sizing decisions.
- Cross-zone routing alerts: flags when drivers routinely leave their assigned zone, a boundary misalignment signal.
- Zone performance dashboard: stops-per-mile, cost-per-stop, overtime rate, and on-time delivery by zone in one view.
- Scenario modelling: test boundary changes and cap adjustments against historical demand data before rolling out.
What Data You Need to Design Effective Zones
Effective zone design starts with four input categories.
You need at least 90 days of historical stop data covering location, frequency, service time, and delivery outcome. Beyond that, you need driver and vehicle availability by shift and day, dwell time actuals by stop type, and reattempt data broken down by zone.
Without these inputs, your zone boundaries reflect assumptions rather than operational reality.
According to Trucking Info’s analysis of driver detention, the industry lost over 135 million hours of driver productivity to detention in 2023 alone, a direct consequence of poorly matched stop volumes eroding productive hours per shift.
Keeping Zones Accurate Over Time
Zone accuracy degrades silently, so build a review rhythm before drift becomes a problem.
Review your zone performance data quarterly and after any significant demand change. Track cross-zone routing frequency as a reliable boundary drift indicator.
Finally, update your dwell time assumptions annually. Customer mix and stop complexity shift faster than static averages reflect, and outdated assumptions quietly undermine the work you put into zone design.
Best-Fit Use Cases
Urban Last-Mile Fleets
In high-density urban environments, zone calibration is your primary lever for reducing cost-per-stop. Tighter, well-shaped zones cut inter-stop drive time and increase stops-per-hour without requiring additional vehicles.
Demand in urban areas shifts frequently, making quarterly zone reviews a practical necessity rather than an optional exercise. When your zone boundaries fall out of alignment with actual stop density, no amount of routing optimization recovers the efficiency you are losing at the structural level.
Multi-Region Distribution Networks
When you operate across multiple regions, zones become the planning unit for capacity allocation across your entire network. Without a reliable zone structure, matching driver hours and assets to where demand is densest becomes guesswork.
Managing fleet routes across multiple locations depends on that zone layer to stay accurate.
Cross-region performance benchmarking then tells you which regions are at a structural disadvantage due to zone design rather than operational underperformance, a distinction that directly shapes where your next resource investment should go.
3PLs Managing Multiple Client Service Areas
When you manage multiple clients from a shared driver pool, zone design is what prevents one client’s volume surge from quietly eroding another’s service level.
Start by separating client service areas into distinct zones, then build overflow rules that activate when a client’s volume drops below cap. That structure keeps your pool productive without creating SLA conflicts.
Optimising 3PL routes across client accounts only holds at scale when each client has a defined zone boundary to plan against. Without it, shared capacity becomes a liability rather than an advantage.
Implementation Best Practices

Start with your highest-cost zones. Poor cost-per-stop and high overtime rates tell you exactly where zone design is failing, and fixing those first delivers visible results quickly.
Once you have your priority zones identified, set stop caps using actual dwell time and inter-stop drive time from the last 90 days rather than estimates. Before rolling out changes, involve your drivers. They flag access constraints and boundary issues that no mapping data will catch.
Common Zone Design Mistakes to Avoid
- Drawing zones around administrative boundaries such as postcodes rather than demand density clusters.
- Setting stop caps based on vehicle capacity (parcels) rather than time capacity (driver hours and dwell time).
- Never reviewing zone performance data, causing zones correct at launch to become structurally misaligned within 12 to 18 months.
- Treating cross-zone routing as normal rather than a zone design failure that needs correction.
KPIs to Track After Zone Redesign
Proving impact from a zone redesign requires zone-level metrics rather than fleet-wide averages. The measures most directly tied to zone quality are:
- Stops-per-mile by zone
- Stops-per-hour by zone
- Cost-per-stop by zone
- Overtime rate by zone
- On-time delivery rate by zone
- Reattempt rate by zone
- Cross-zone routing frequency
Tracking top KPIs for last-mile delivery performance at zone level shows you exactly where your redesign is holding and where boundaries still need refinement.
How CIGO Tracker Supports Zone-Based Delivery Planning
With CIGO Tracker, execution data flows directly back into your zone calibration. Stop times, dwell actuals, and failure reasons give you the ground-truth inputs your zone design depends on.
Logistics optimization identifies which zones are structurally underperforming versus which have operational issues you can fix through process changes. Delivery tracking and optimized routing then give you real-time visibility by zone, so you can rebalance same-day before a zone trending toward overload compounds into the following day’s backlog.
Future Trends in Intelligent Delivery Zoning
Zone planning is shifting from a periodic task to a continuous process.
AI-driven boundary optimisation rebalances zones automatically as demand patterns change, removing the lag that static structures create. Dynamic capacity caps adjust in real time based on live driver availability and route performance, moving planning from daily to intra-day.
McKinsey research shows AI can cut logistics costs by 5% to 20%, and demand-integrated zoning connects your order management system directly to zone capacity calendars so you start capturing that gap.
Are Your Zones Actually Built for the Routes You’re Running?
Intelligent zoning is the structural foundation that makes route optimisation work. Pull your cost-per-stop and overtime data by zone for the last 90 days, identify your two worst zones, and run a demand density mapping exercise to find the obvious misalignments.
CIGO Tracker gives you the execution data to do exactly that. Start your free trial or contact the team today.
FAQs
What is zone-based delivery planning and how does it differ from route optimisation?
Zone-based delivery planning divides a service area into geographic segments managed separately for capacity, routing, and driver allocation. Route optimization sequences stop within a zone; zone planning determines whether that zone is correctly sized for the demand it carries.
How do I know if my delivery zones need redesigning?
Signs include chronic overtime in specific zones, consistently high reattempt rates in certain areas, routes finishing significantly early or late in the same zones, and drivers regularly crossing zone boundaries to cover stops that should be reassigned.
How to plan delivery zones step by step?
Map demand density, separate stop types by service time, identify driver and vehicle constraints, set stop caps at 85% to 90% of theoretical capacity with tiered alert thresholds, and run a quarterly performance review to recalibrate as demand shifts.
What data do I need to design effective delivery zones?
You need at least 90 days of historical stop data by location, frequency, and service time; driver shift availability by day; actual dwell time per stop type; and reattempt or failure data by zone to flag structural zone design problems.
What KPIs should I track after redesigning delivery zones?
Track stops-per-mile, cost-per-stop, overtime rate, on-time delivery rate, and reattempt rate by zone. Add cross-zone routing frequency as a leading indicator of zone boundary drift. Review all these metrics quarterly against pre-redesign baselines to confirm sustained improvement.