Fuel is measurable. That’s why it gets your attention.
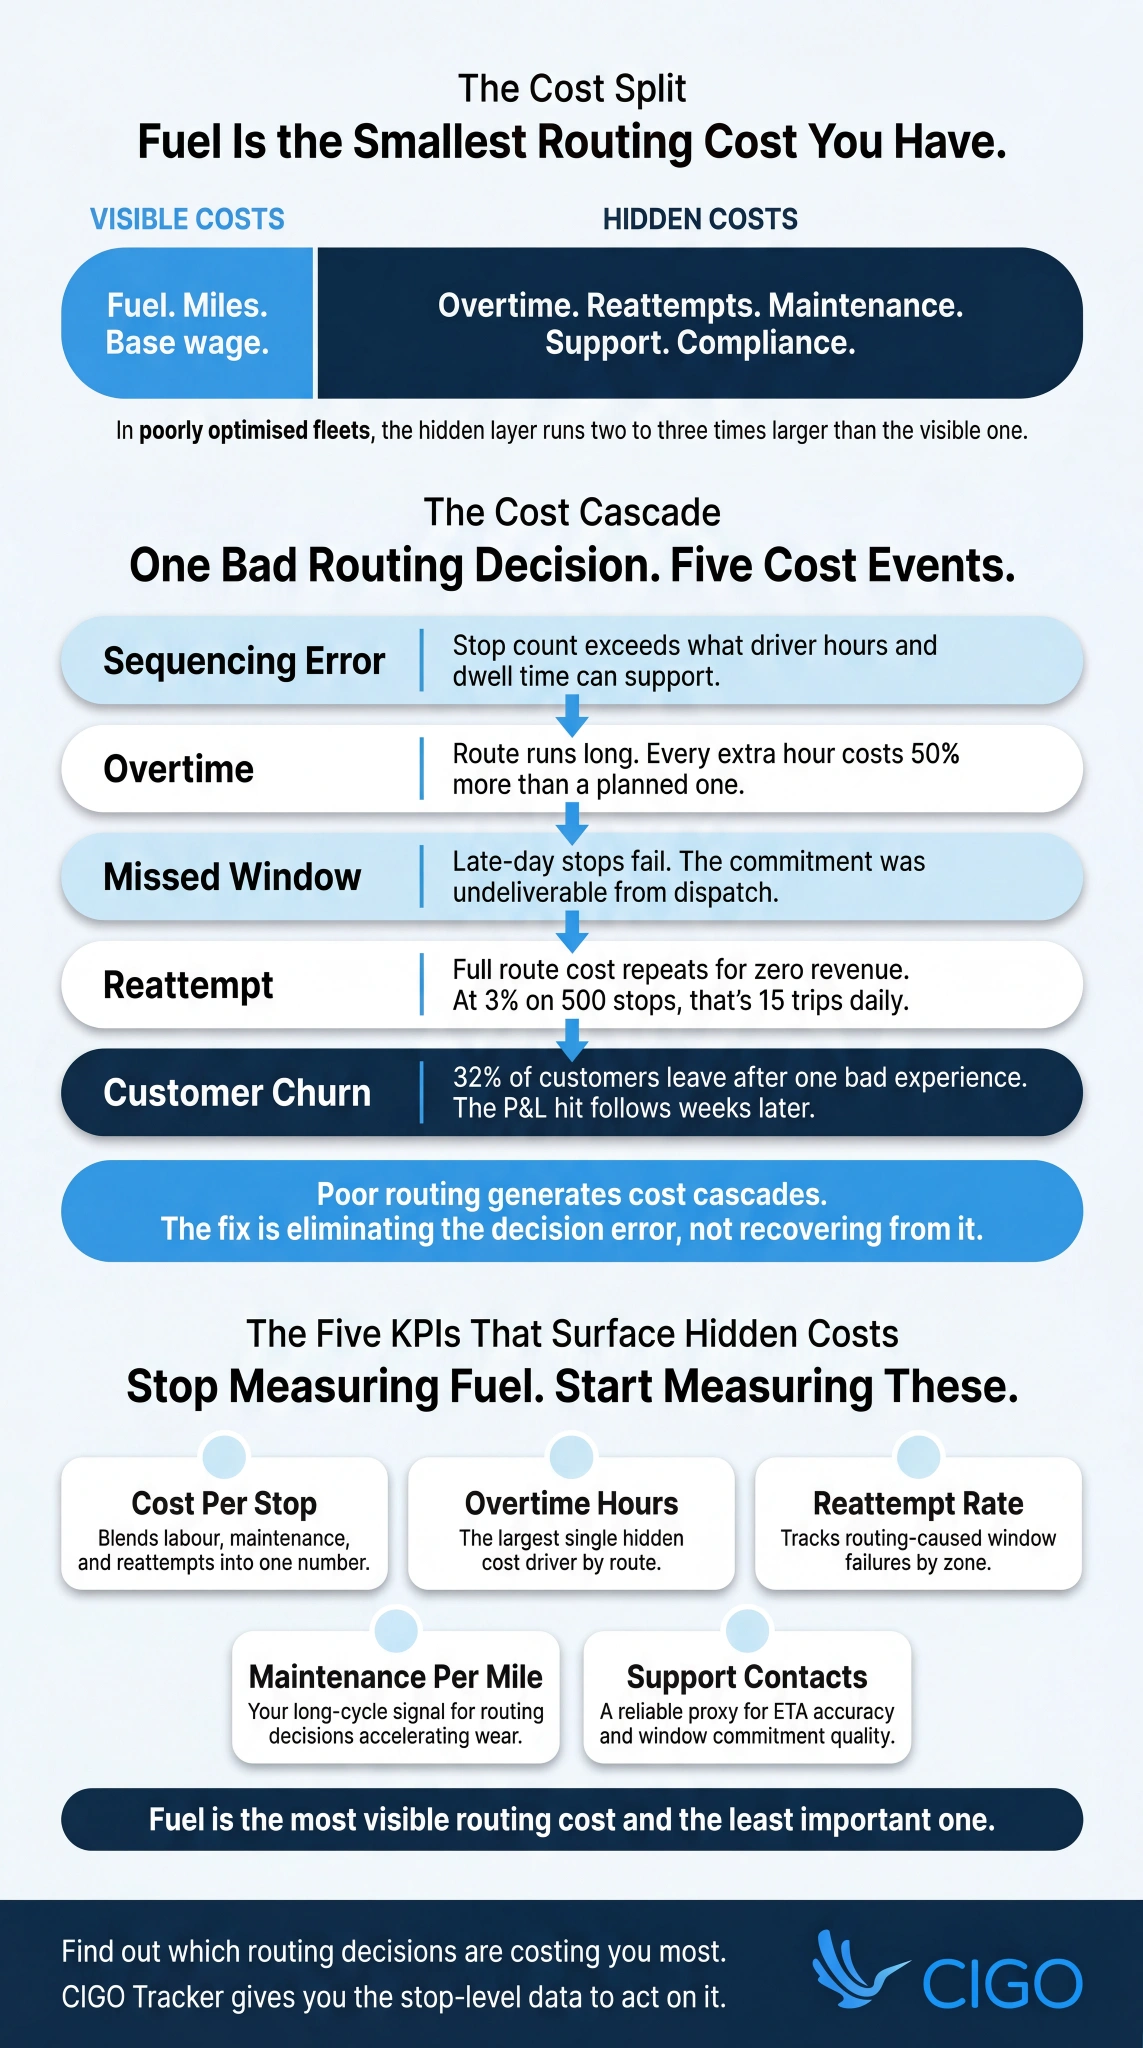
But fuel is actually the smallest routing cost you have. The real damage lives in your labour overtime, failed delivery reattempts, vehicle wear, and customer support overhead, spread across P&L lines you’d never connect back to a routing decision.
That’s the problem. Poor routing generates cost cascades. A bad sequence creates overtime. Overtime triggers a missed window. That missed window becomes a reattempt, then a customer contact, then churn.
CIGO Tracker exists to break that chain before it starts.
Key Takeaways
- Fuel is the smallest part of what poor routing costs you. Labour, reattempts, maintenance, and support overhead are where hidden costs last-mile delivery actually live.
- Every bad sequencing decision creates a cost cascade across multiple P&L lines. That’s the problem delivery routing software is built to solve.
- Between 35 and 58% of trucks run with underutilised capacity, and wasted miles drive disproportionate labour costs on the same route.
- Last-mile delivery route optimization reduces costs by eliminating failure events, not just cutting miles.
- The KPIs that surface route optimization cost savings fastest are cost per stop delivery fleet metrics, reattempt rate, and overtime hours, not fuel spend.
The Real Cost Structure of a Delivery Route
Every delivery route you run carries two layers of cost, and only one of them shows up on your routing report.
The visible layer includes fuel, vehicle depreciation, and driver base pay. These are the numbers your team reaches for first. They’re measurable, familiar, and easy to defend.
The hidden layer is where the real damage accumulates. Overtime premium, unplanned maintenance, reattempt costs, support overhead, and compliance exposure rarely appear on any single report.
Visible Costs vs. Hidden Costs in Last-Mile Delivery
- Visible: fuel, vehicle depreciation per mile, driver base wage per shift, tolls, and fixed route costs. These show up on your routing cost report.
- Hidden: overtime premium, vehicle repair and unplanned maintenance, failed delivery reattempt costs, customer support overhead, empty miles and wasted capacity, and regulatory fines. These show up everywhere else on your P&L.
Optimising only for fuel and miles reduces your visible costs while leaving the larger hidden cost layer completely untouched. But in poorly optimised fleets, this layer runs two to three times larger than the visible one, and it’s almost entirely driven by routing decision quality.
Why Routing Decisions Drive Both
Every routing decision you make, whether it’s a sequence call, a load allocation, or a window commitment, carries both a visible fuel impact and a hidden downstream cost.
A sequence that packs 35 stops into an eight-hour shift looks efficient on paper.
If those stops actually require nine hours, you’ve just created overtime and a reattempt before the route even starts.
McKinsey’s analysis of mid- and last-mile logistics handovers found that 13 to 19% of logistics costs stem from blind handoffs. Poor routing decisions work the same way: the waste embeds silently before anyone notices.
The Hidden Cost Categories Poor Routing Creates
Excessive Driver Labour: Overtime and Idle Time
Labour accounts for 50 to 60% of your total last-mile costs, making it the single largest expense on every route. When your routing generates overtime through unrealistic stop counts or underestimated dwell time, you are compounding your most expensive line item directly.
Overtime at 1.5x base means every routing-caused hour costs 50% more than a correctly planned one.
That premium never appears on a fuel report. According to the U.S. Bureau of Labor Statistics, the median annual wage for light truck drivers reached $44,140 in May 2024, with many working beyond 40 hours per week.
As a result, driver retention and routing quality are more connected than most teams realise.
Vehicle Wear and Unplanned Maintenance
Every extra mile your routing adds accelerates wear, shortens replacement cycles, and increases maintenance frequency. None of that shows up on your routing report. It surfaces weeks later as a repair bill you can’t trace back to the original cause.
That delay is where the real cost hides. According to Heavy Vehicle Inspection’s 2026 fleet maintenance analysis, unplanned downtime costs your fleet $448 to $760 per truck per day.
Poor routing also creates vehicle-stop mismatches, where you send an oversized vehicle on a small delivery simply because it’s available, accelerating wear beyond what mileage alone explains.
Failed Deliveries and Reattempt Costs
Every failed delivery costs you the full expense of a completed stop, with none of the revenue. Driver time, fuel, and overhead repeat entirely for zero return. That adds up faster than most teams realise.
At 3% reattempts on 500 daily stops, you’re running 15 full-cost repeat trips every single day.
Before you can fix that, you need to know why stops are failing. Electronic proof of delivery gives you stop-level data to separate routing-caused failures from customer absences or access issues, so your fix targets the actual problem.
Regulatory and Compliance Costs
Poor routing doesn’t just cost you money operationally. It creates compliance exposure you may not see coming until the fine arrives.
- Hours-of-service violations: Routes that push beyond legal driver limits expose you to fines ranging from $1,300 to $15,000+ per incident, depending on severity and record.
- Emissions zone routing: Sending the wrong vehicle through a restricted zone, at the wrong time, generates compounding fines at scale that your routing decision created.
- Missed appointment penalties: Contractual dock window penalties land directly on your P&L when routing doesn’t account for realistic travel and dwell time.
Empty Miles and Wasted Capacity
Empty miles and underutilised capacity are planning failures, not execution ones. By the time your driver leaves the depot, the cost is already locked in.
A 2025 Flock Freight and Drive Research study found that 58% of truckloads moved partially empty in 2024, up from 43% in 2023.
When your vehicles run at 50 to 60% capacity, you still absorb fixed costs at 100%.
Consolidation opportunities missed at the planning stage are where that gap originates, and they rarely appear on your fuel or mileage report because the cost spreads invisibly across your fleet.
How Routing Decisions Cause Each Hidden Cost

The connection between routing decisions and hidden costs is causal, not coincidental. Each cost category has a specific type of routing decision as its primary driver.
Sequencing Errors That Create Overtime
Most overtime isn’t a driver problem. It’s a sequencing problem built into the route before the shift started.
- Overloaded stop counts: More stops than driver hours and dwell time can realistically support. The most common cause of overtime in fleets without capacity management.
- Wrong stop order: Sequencing geographically without enforcing time windows forces backtracking that extends your total route time.
- No end-of-route buffer: Tight windows on final stops make late-day overtime structurally inevitable.
- Uniform dwell time: Applying the same estimate to every stop ignores real differences that compound across the full route.
Load Allocation Decisions That Increase Maintenance
How you allocate loads matters as much as how far you drive.
Assigning heavy payloads without considering axle weight distribution accelerates brake, tyre, and suspension wear before you’ve covered half the route.
Poor vehicle-stop matching compounds this further. Sending a large vehicle for a small delivery inflates both fuel cost and wear relative to the right asset. That decision looks minor at route level, but over a quarter it becomes a maintenance bill you didn’t plan for.
Window Commitment Decisions That Drive Reattempts
Most reattempts are booked before the route starts. Here’s where the decision goes wrong.
- Tight windows in overloaded zones: You’re scheduling a failure at the booking stage.
- Consecutive tight windows without dwell time: A late-cascade that guarantees violations from stop 15 onward.
- No access or appointment constraints: Your driver discovers the dock booking requirement on arrival, not in the sequence.
- Ignoring cumulative zone capacity: One overcommitted zone costs you multiple reattempts, not one.
How to Quantify Hidden Routing Costs in Your Fleet
The goal is to make each hidden cost category visible and attributable to specific routing decisions. That’s what builds the investment case for delivery routing software in your actual numbers, not industry averages.
Building a Route-Level Cost Model
You can’t reduce routing costs you haven’t measured. Start here.
- Driver labour: Shift hours multiplied by labour rate, including overtime premium. Trace which routes systematically generate overtime and why.
- Maintenance allocation: Total maintenance spend divided by fleet miles gives you cost per mile. Apply it to above-average mileage routes.
- Reattempt cost: Total reattempts multiplied by average route cost, divided by total routes. Compare high-attempt zones against their routing history.
- Support overhead: Inbound delivery contacts multiplied by handling cost, attributed to routes where your ETA accuracy was poor.
The Metrics That Surface Hidden Costs First
Start with cost-per-stop by route. It blends labour, maintenance, and reattempts into one number, so you see the full picture rather than just fuel spend.
From there, track overtime hours by route to identify sequencing failures, reattempt rate by zone to catch window commitment problems, and maintenance cost per vehicle by route assignment to spot where specific routes are accelerating wear.
Together, these four metrics tell you exactly where your routing decisions are costing you most.
How Delivery Routing Software Eliminates Hidden Costs
Delivery routing software doesn’t just find you a faster route. It eliminates the decision errors that generate hidden costs downstream by building every cost-relevant constraint directly into your planning model.
Understanding what route optimization actually does in practice clarifies why improving your cost-per-stop requires more than shortening drive time.
Real-Time Optimisation vs. Day-Before Planning
Static day-before plans lock in decisions before conditions are known. Real-time routing closes that gap throughout execution.
| Day-Before Static Planning | Real-Time Optimization | |
| Route adjustments | Fixed at dispatch | Updated throughout the day |
| Overtime risk | Overloaded routes cascade unchecked | Rebalanced before they compound |
| Reattempt risk | Window commitments can’t adapt | Updated when conditions change |
| Cost visibility | Gaps discovered after the shift | Identified and corrected in real time |
The cost impact of closing that gap is measurable. Supply Chain Dive reported that Walmart reduced store-to-home delivery costs by 20% over one year and cut net delivery cost per order by 40% across three consecutive quarters, with the majority of improvement coming from cost categories beyond fuel.
Last Mile Delivery Route Optimisation Features That Matter for Hidden Costs
The features below don’t just improve efficiency. They directly eliminate the decisions that generate your hidden costs.
- Dwell time modelling by stop type: Removes the single largest contributor to overtime and reattempts.
- Time-window hard constraint enforcement: Prevents window commitments that structurally guarantee failures.
- Load-vehicle matching: Routes payloads to correctly matched vehicles, reducing your wear and fuel cost together.
- Driver HOS compliance: Eliminates overtime and violations at the planning stage, before your shift starts.
- Empty mile minimisation: Surfaces consolidation and backhaul opportunities your static plan would miss entirely.
Key Features Checklist for Routing Software That Cuts Hidden Costs
- Real-time traffic and road condition integration — eliminates travel-time errors that drive overtime and missed delivery windows.
- Dwell time customisation by stop type and zone — the single highest-impact feature for reducing overtime and failed reattempts.
- HOS compliance enforcement in the sequence builder — blocks routing decisions before they become regulatory violations.
- Load optimisation and vehicle-payload matching — trims fuel spend and maintenance costs in a single step.
- Cost-per-stop and route-level profitability reporting — surfaces hidden costs and ties them to specific decisions.
- Empty mile and backhaul identification — recovers wasted capacity that basic routing tools routinely overlook.
What Data You Need to Measure and Reduce Hidden Routing Costs

Route-level labour costs give you the foundation: driver hours, overtime, and shift logs.
Those records become more useful when cross-referenced with vehicle maintenance data by route assignment, helping you spot wear patterns tied to specific routing decisions.
Understanding those decisions means breaking down your reattempt data by root cause, separating routing failures from customer-side issues.
Dwell time actuals by stop type sharpen that picture further, and linking your customer contact log to delivery records quantifies exactly what ETA inaccuracy is costing you in support overhead.
Keeping the Cost Model Current
Your cost-per-stop benchmarks need a quarterly refresh. Fuel prices, labour rates, and maintenance figures shift often enough that an outdated model stops being a reliable management tool.
On a monthly basis, review what is actually driving reattempts. Routing-caused window failures should shrink as your model improves. A flat trend tells you something specific needs recalibrating.
Annually, track maintenance spend per mile by route type. That is your clearest long-run signal for whether vehicle longevity is factoring into your routing decisions.
Best-Fit Use Cases
High-Volume Last-Mile Fleets
Small per-route inefficiencies compound quickly at scale.
Fifteen minutes of unnecessary overtime across 50 routes over 250 days adds up to 3,100 driver hours annually, generated by routing decisions that appeared acceptable.
Your biggest savings opportunity here is hidden cost elimination, not fuel reduction.
B2B Delivery Fleets With Recurring Routes
Recurring routes that go unreviewed accumulate hidden costs quietly, week after week.
The same routing decisions produce the same overtime and reattempts until you build a cost model and surface the pattern. A quarterly review using actual cost-per-stop data is where that changes.
3PLs Managing Cost Across Multiple Clients
Hidden routing costs in 3PL operations erode client-relationship margins, often unnoticed by either party. Without route-level cost reporting, you lose the visibility needed to adjust pricing in time.
That is why 3PL route optimization directly determines how well you protect profitability across accounts.
Implementation Best Practices
Build your hidden cost model before touching any routing software.
That baseline, your cost-per-stop, overtime rate, and reattempt rate by zone, is what lets you measure ROI accurately once improvements take effect.
From that foundation, prioritise dwell time calibration in your first 30 days.
It targets the largest hidden cost driver and costs nothing beyond pulling your actual stop data. Set up route-level reporting before optimising, then brief your drivers and dispatchers so every routing decision reflects the full cost behind it.
Common Mistakes to Avoid
- Measuring ROI only on fuel savings. Fuel is the smallest component of hidden cost reduction. Focusing on it alone means you are dramatically understating the value of your investment.
- Optimising routes without fixing dwell time inputs. A perfectly sequenced route with wrong dwell time assumptions still generates overtime and reattempts. The algorithm can only work with what you give it.
- Attributing reattempts to customers rather than routing decisions. Most window-miss reattempts are routing failures. Your customer was not home because the window was wrong, not because they missed the delivery.
KPIs to Track Hidden Routing Costs
- Cost-per-stop by route and zone — your primary blended metric, capturing all hidden costs in one actionable number.
- Overtime hours by route — the largest single hidden cost driver, which should decline as your dwell time inputs and stop counts improve.
- Reattempt rate by zone and window type — tracks routing-caused failures that generate full-cost repeat trips.
- Maintenance cost per vehicle by route assignment — your long-cycle signal for routing decisions quietly accelerating wear.
- Empty miles percentage — the share of fleet miles driven without revenue-generating cargo.
- Customer support contacts per route — a reliable proxy for your ETA accuracy and window commitment quality.
How CIGO Tracker Reduces Hidden Routing Costs
CIGO Tracker’s route optimization captures the execution data that makes hidden costs visible: actual stop times, dwell durations, and failure reasons linked to specific routing decisions. That data gives you the stop-level detail needed to calculate true labour cost per delivery, while logistics optimization analyzes operational data to identify and implement efficiency improvements across your entire chain.
Your delivery tracking and event alerts then surface recurring routing decisions generating the most hidden costs, so planners act on evidence rather than instinct.
Future Trends in Route Optimisation and Cost Reduction
Routing engines are shifting toward cost-aware optimisation, building labour, maintenance, and reattempt costs directly into the objective function rather than just minimising miles.
That shift changes the decisions your platform recommends, and predictive maintenance routing takes it further by matching route intensity to individual vehicle wear state so high-mileage runs protect your higher-wear vehicles.
According to McKinsey, embedding AI across distribution operations can reduce logistics costs by 5 to 20%, with automated cost attribution closing the loop between your routing decisions and finance teams in real time.
Are You Optimising for Fuel or for Actual Cost?
Fuel is the most visible routing cost and the least important one. Labour, reattempts, maintenance, and compliance are where the real money goes, and routing decisions control all of them.
Build your route-level cost model and the patterns will show you exactly where to act. CIGO Tracker gives you the stop-level data to measure and reduce the costs that actually move your margins.
FAQs
What are the hidden costs of poor routing decisions in last-mile delivery?
Poor routing creates hidden costs that last mile delivery operations rarely track directly: driver overtime, unplanned vehicle maintenance, failed delivery reattempts, customer support contacts, and compliance fines. These cost-per-stop impacts spread across multiple P&L lines and are rarely linked back to the routing decisions that caused them.
How do I calculate the true cost per stop for your delivery fleet?
Add driver labour per route including overtime, maintenance cost per mile applied to route mileage, reattempt cost by zone, and support contacts per route. That blended cost per stop delivery fleet benchmark reveals what last-mile delivery route optimization is actually worth to your operation.
How does delivery routing software reduce costs beyond fuel savings?
Delivery routing software eliminates overtime through realistic stop counts and dwell time modelling, prevents reattempts through window constraint enforcement, and reduces maintenance through load-vehicle matching. Route optimization cost savings beyond fuel are typically three to five times larger than fuel reductions alone.
What is last-mile delivery route optimization and how does it work?
Last-mile delivery route optimization sequences your stops to respect time windows, driver hours, vehicle constraints, and dwell time assumptions, reoptimising in real time as conditions change. It closes the planning gaps that basic routing cannot address, which is where most hidden costs last mile delivery teams carry are generated.
What KPIs should I track to surface hidden routing costs?
Track cost per stop by route, overtime hours, reattempt rate by zone and window type, maintenance cost per vehicle by route assignment, empty miles percentage, and customer support contacts per route. These KPIs surface hidden costs faster than fuel data and give your delivery routing software the feedback loop it needs to keep improving.