
Customers expect faster, more reliable service than ever before. And we need to keep them happy. Thus, measuring and optimizing your delivery performance is not just beneficial. It’s essential for staying competitive.
The right last mile delivery KPI metrics provide the visibility you need to:
- Identify bottlenecks
- Reduce costs
- Exceed customer expectations
When used consistently, performance data becomes the engine behind faster deliveries. It also improves customer loyalty.
Key Takeaways
- Last mile delivery accounts for 50%+ of total delivery cost, making performance measurement critical.
- On-time delivery rate and first attempt success rate are foundational metrics for customer satisfaction.
- CIGO Tracker customers typically see 20-30% shipping cost reductions and 12-18% improvements in on-time delivery rates.
- Cost per delivery and vehicle utilization provide insights for margin management and resource optimization.
Why Last Mile Delivery KPI Matters
The last mile represents the most expensive and complex segment of the delivery metric. It often accounts for 53% of total delivery costs, as reported by ScienceDirect. This final stretch from distribution center to customer doorstep involves numerous variables. They can impact efficiency and customer satisfaction.
Last mile delivery KPIs serve as your operational compass, helping you:
- Identify inefficiencies that drain resources and increase costs.
- Spot trends and patterns that inform strategic decisions.
- Improve customer experiences through data-driven optimizations.
- Reduce operational overhead by eliminating waste and delays.
- Benchmark performance across different routes, regions, or time periods.
Without proper measurement, logistics managers are essentially flying blind. This makes decisions based on assumptions rather than actionable data. CIGO Tracker customers rely on automated KPI tracking. It transforms raw delivery data into strategic insights that drive continuous improvement.
1. On Time Delivery Rate
On-time delivery rate measures the percentage of deliveries completed within the time window. This foundational metric directly impacts customer satisfaction and loyalty. This makes it one of the most critical last mile delivery performance metrics to track.
Industry benchmarks vary by sector. But top-performing logistics operations typically achieve on-time rates of 95% or higher. Lower average time rates often point to routing inefficiencies. These create:
- Unrealistic delivery schedules
- Capacity constraints during peak periods
- Poor communication between dispatch and field teams
- A lack of buffer time to accommodate unexpected delays
CIGO Tracker Advantage:
CIGO Tracker offers real-time route optimization and dynamic delivery window adjustments. Logistics teams see 12 to 18 % improvements in on-time delivery rates. And it happens within the first quarter of implementation.
To improve this KPI, focus on:
- Setting realistic promise times
- Using optimized routing
- Maintaining proactive communication with customers about potential timing changes
Connected systems like CIGO Tracker help by automatically adjusting delivery windows. The system bases these adjustments on real-time traffic and historical performance data.
2. First Attempt Delivery Success Rate
This is one of the last mile delivery metrics. It tracks how often your drivers complete deliveries on their first attempt. Failed first attempts increase operational costs and customer frustrations. This often requires expensive re-delivery attempts.
A strong first attempt delivery success rate often exceeds 85% and indicates:
- Effective route planning that considers customer availability.
- Accurate customer contact information and delivery preferences.
- Clear communication about delivery windows.
- Proper package handling that prevents damage-related rejections.
CIGO Tracker Advantage:
CIGO Tracker customers get:
- Automated customer notifications
- GPS-based delivery predictions
- Intelligent scheduling that considers historical delivery patterns
This results in first-attempt success rates of 90% or higher. Your delivery accuracy and timely delivery rates will skyrocket.
Strategies to improve this metric include:
- Better customer communication tools
- Flexible delivery windows
- Providing customers with real-time tracking information
Modern platforms integrate these capabilities into daily operations.
3. Average Delivery Time
Average delivery time measures the duration from dispatch to completed delivery. This provides insights into operational efficiency and customer experience quality. This metric helps identify patterns that impact delivery speed and reliability. At the same time, it also reveals opportunities for route optimization improvements.
Key factors that influence delivery time include:
- Traffic patterns during different times of day.
- Route optimization effectiveness.
- Driver efficiency and familiarity with routes.
- Customer location accessibility and parking availability.
CIGO Tracker Advantage:
CIGO Tracker’s machine learning algorithms analyze traffic patterns and historical delivery data. So operations teams can reduce average delivery times by 15-25%. Meanwhile, they can maintain service quality.
Use this data to:
- Optimize delivery windows
- Adjust route planning
- Identify training opportunities for your delivery team
The most effective systems provide both real-time monitoring and historical trend analysis.
4. Cost per Delivery
It’s one of the most important delivery efficiency indicators. Cost per delivery calculates the average expense associated with each completed delivery. This comprehensive metric includes labor costs such as:
- Driver wages
- Benefits
- Overtime
- Fuel and vehicle operating expenses
It also accounts for the cost of failed delivery attempts. And the administrative overhead required to manage delivery operations.
It’s critical to understand your true cost per delivery. It enables accurate pricing decisions and reveals opportunities to improve profit margins. Benchmark this metric against industry standards. Then watch it over time to assess the impact of your optimization strategies.
CIGO Tracker Advantage:
CIGO Tracker offers integrated cost tracking and route optimization. It usually helps logistics providers reduce cost per delivery by 20 to 30%. This occurs through improved routing efficiency and a reduction in failed delivery attempts.
5. Order Accuracy Rate
Order accuracy rate tracks the percentage of deliveries completed without errors. These include wrong items, missing products, or damaged goods. Delivery mistakes cost money through returns, replacements, and damaged customer relationships.
This metric correlates with:
- Customer satisfaction and retention rates.
- Return and refund costs.
- Brand reputation and trust.
- Operational efficiency throughout the fulfillment process.
To maintain high accuracy rates:
- Have quality control checkpoints
- Improve warehouse processes
- Provide driver training
Digital proof of delivery systems help ensure accountability throughout the delivery chain.
CIGO Tracker Advantage:
CIGO Tracker offers digital proof of delivery and quality control workflows. Then customers achieve order accuracy rates above 98%. This reduces dispute resolution time by 60%.
6. Customer Satisfaction Score (CSAT)
Quantitative metrics tell part of the story. But customer satisfaction scores provide qualitative insights into the delivery experience. CSAT scores reveal how customers perceive your service quality. They’re often gathered through post-delivery surveys.
CSAT data helps identify service gaps not visible in operational metrics. It also highlights driver performance from the customer’s perspective. Finally, it assesses how effectively you handle communication throughout the delivery process. It also uncovers areas to enhance service based on direct customer feedback.
Combine CSAT data with operational metrics. You can then gain a complete picture of delivery performance. Top-performing operations maintain CSAT scores above 4.5 out of 5.0. This indicates positive customer experiences and customer engagement.
7. Driver Performance Score
It’s a composite metric that combines various performance indicators. The driver performance score evaluates individual driver effectiveness across dimensions. It measures delivery timeliness and adherence to planned routes. It also tracks safety records and vehicle handling. Finally, it assesses the quality of customer interactions along with professionalism. It also factors in fuel efficiency and how well drivers maintain their vehicles.
This last mile delivery tracking metric helps identify top performers for recognition. It also highlights drivers who may get more training. They can then share their best practices across the team. You can also link performance data to incentive programs. This encourages continuous improvement and fosters a culture of accountability.
CIGO Tracker Advantage:
CIGO Tracker’s comprehensive driver scorecards provide real-time performance feedback. They include gamification features. These improve driver engagement and performance by an average of 22 percent.
8. Average Number of Deliveries per Route
This efficiency metric indicates how well you’re utilizing each delivery route.
Low numbers may suggest poor routing optimization or under-utilization of driver capacity. At the same time, high numbers with good success rates reveal efficient operations.
Consider these factors when analyzing this metric:
- Geographic density of delivery locations.
- Package size and weight constraints.
- Delivery time requirements and customer preferences.
- Traffic patterns and route complexity.
Use advanced route optimization to maximize deliveries per route while maintaining service quality. Machine learning algorithms can identify patterns that human planners might miss.
9. Vehicle Utilization Rate
Vehicle utilization rate measures how effectively you use each vehicle. This includes both capacity and time. This metric helps fleet managers plan:
- Maintenance schedules
- Assess scaling needs
- Identify scheduling inefficiencies
You should track utilization across several key dimensions. Review the amount of cargo capacity on each trip. And you can ensure vehicles are carrying optimal loads.
Compare daily operational hours with total available hours. This helps you determine whether your fleet is running at full potential. Measure distance efficiency to see if vehicles are covering routes. Do this in a way that maximizes their range and purpose. Also consider downtime for maintenance, loading, and administrative tasks. This can reduce productivity when left unmonitored.
Optimizing vehicle utilization reduces fleet costs and improves operational efficiency. Smart scheduling systems can automatically balance capacity constraints with delivery requirements. This helps you get more value out of every vehicle on the road.
10. Exception Rate
The exception rate is a great KPI to review. It tracks the percentage of deliveries affected by unforeseen issues. These include:
- Traffic delays
- Weather conditions
- Incorrect addresses
- Missed customer handoffs
This last mile logistics performance indicator helps identify systemic problems that affect consistency.
Common exceptions include:
- Weather-related delays and route modifications. These may force drivers to slow down, reroute, or pause deliveries altogether. They need to maintain safety and compliance.
- Traffic incidents and road closures. These disrupt planned routes and cause unplanned detours that throw off delivery schedules.
- Address errors and access issues. They include incomplete delivery information, gated properties, or inaccurate geolocation data. These prevent successful drop-offs.
- Customer unavailability during delivery windows. This leads to failed delivery attempts. It then often requires rescheduling or a second trip.
CIGO Tracker Advantage:
CIGO Tracker leads the industry in real-time exception management with predictive analytics. These help operations teams address potential issues before they impact deliveries. This reduces exception rates by up to 40 percent.
Reducing exception rates improves predictability and customer trust while lowering operational costs.
How to Collect and Analyze Last Mile KPIs
Effective KPI tracking requires robust data collection and analysis systems.
CIGO Tracker automates much of this process. This provides real-time visibility into delivery operations. And you won’t need manual data entry or complex integrations.
Key components of an effective tracking system include:
- Automated data collection through GPS tracking, mobile apps, and integrated systems.
- Real-time dashboards that display current performance metrics.
- Historical reporting capabilities for trend analysis.
- Integration with existing systems like CRM, TMS, and ERP platforms.
- Mobile accessibility for field managers and executives.
CIGO Tracker’s comprehensive platform eliminates data silos. It does this by connecting all delivery touchpoints. So you’ll have a single, unified view of performance metrics.
Using KPI Data to Drive Improvements
Collecting metrics is only the first step.
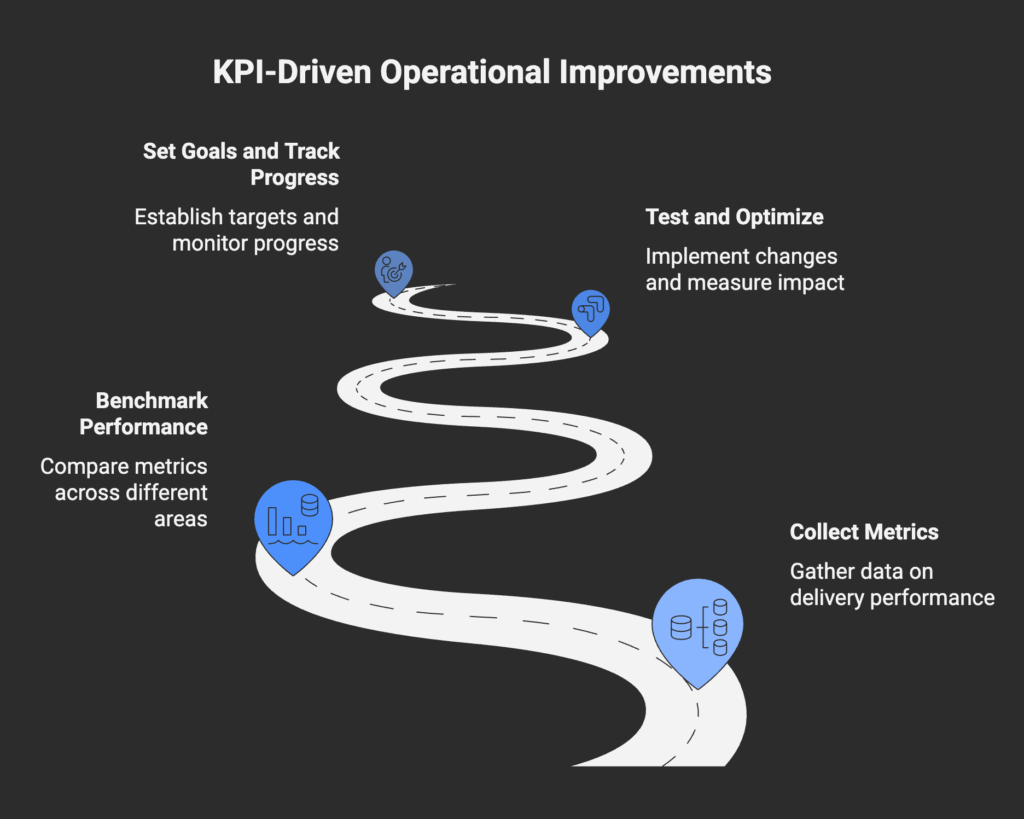
The real value comes from using this data to drive operational improvements. Effective last mile delivery tracking involves systematic analysis and action planning.
Benchmarking Performance
- Compare metrics across different routes, regions, or time periods.
- Establish baseline performance levels for new initiatives.
- Identify best-performing teams and practices for replication.
Testing and Optimization
- Make changes like new delivery windows or route configurations.
- A/B test different approaches to measure impact.
- Roll out successful optimizations across the broader operation.
Goal Setting and Progress Tracking
- Establish realistic but challenging performance targets.
- Review progress toward goals with regular reporting.
- Adjust strategies based on performance trends and market changes.
CIGO Tracker’s advanced analytics are ideal for logistics teams. We can identify improvement opportunities 3x faster than traditional methods. This enables rapid optimization cycles that compound performance gains over time.
Transform Your Last Mile Performance with Data-Driven Insights

Last mile delivery KPI serves as the foundation for building customer trust. It also drives operational excellence. Regular measurement and analysis:
- Support continuous improvement
- Strengthen last mile delivery performance
- Create a clear competitive advantage in today’s logistics landscape
The key to success lies in selecting the right metrics for your business. You also want to install reliable tracking systems. Finally, be sure to use the data to drive continuous improvement. CIGO Tracker offers comprehensive route optimization and real-time tracking capabilities. These enable logistics providers to review these critical KPIs. Meanwhile, you can make data-driven decisions that enhance operational efficiency and customer satisfaction.
Ready to master these KPIs and transform your last mile operations? See how CIGO Tracker can help your team achieve industry-leading performance metrics. Schedule a personalized demo today. You can explore our:
- Real-time dashboards
- Automated reporting tools
- Proven optimization strategies
These have helped logistics providers reduce costs by 30%. And you can improve customer satisfaction scores in the meantime.
Frequently Asked Questions
1. What are KPIs in last mile delivery?
KPIs (Key Performance Indicators) are measurable values. They help assess how effectively a company is achieving its last mile delivery goals. They provide insight into efficiency, cost control, customer satisfaction, and logistics performance.
2. Why are KPIs important for last mile delivery?
The last mile is often the most expensive and complex part of the delivery process. Monitoring KPIs helps businesses identify inefficiencies. It also helps reduce costs and improve customer experience. Finally, you can make data-driven improvements to operations.
3. What are the most common KPIs used to track last mile success?
Some of the top KPIs include:
- On-time delivery rate
- Delivery success rate
- Cost per delivery
- Average delivery time
- Customer satisfaction score (CSAT)
- First attempt delivery rate
These metrics help measure speed, accuracy, and customer impact.
4. How often should we review last mile KPIs?
You should review KPIs daily or weekly for operational metrics. Then, review monthly or quarterly for strategic analysis. Frequent monitoring allows teams to respond to issues and maintain high performance.
5. How can businesses improve poor last mile KPIs?
Improvements can come from:
- Better route optimization
- Enhanced driver training
- Real-time tracking systems
- More accurate delivery windows
- Customer communication tools
Identifying the weak points through KPIs is the first step toward meaningful change.