Static delivery zones are designed around average conditions. The problem is that average conditions rarely show up on your busiest days.
Volume shifts, a truck goes down, and one team runs two hours late while another sits idle. The zone looked fine in the briefing. It just couldn’t hold under real load.
A dynamic zone management system adjusts delivery zones to real capacity, demand density, and true stop costs. CIGO Tracker is built around that visibility. This guide covers what it is, why static zones break, and the KPIs that prove it’s working.
Key Takeaways
- A dynamic zone management tool adjusts delivery zones based on real capacity, demand, and constraints, not static boundary lines.
- Dynamic zones reduce overload days by balancing stops, miles, and service time across what each team can actually execute.
- Better zone design improves ETA accuracy because routes start with fair workload distribution rather than optimistic assumptions.
- The strongest results come when zones incorporate real stop-time and exception data, not just geographic proximity.
- Clear rezoning rules and approval thresholds prevent dynamic zones from becoming a source of daily chaos rather than a cure for it.
What Is a Dynamic Zone Management System?
A dynamic zone management system builds and updates delivery zones in response to demand patterns and available capacity. It is not a routing tool, though it works alongside one.
It is the layer that decides how work gets partitioned across the fleet before routing determines the sequence within each zone.
Research published by Transportation Research on dynamic freight management confirms that static logistics models consistently fail to account for real-world variability, and that adaptive, data-driven systems reduce congestion and improve operational efficiency where static approaches fall short.
In practice, dynamic zone management replaces zip-based boundaries and manual redraws, turning dispatcher intuition into enforceable rules. Orders flow in, zones are shaped to balance workload, and execution data feeds back into the model so boundaries improve over time.
Dynamic Zone Management vs. Static Zones
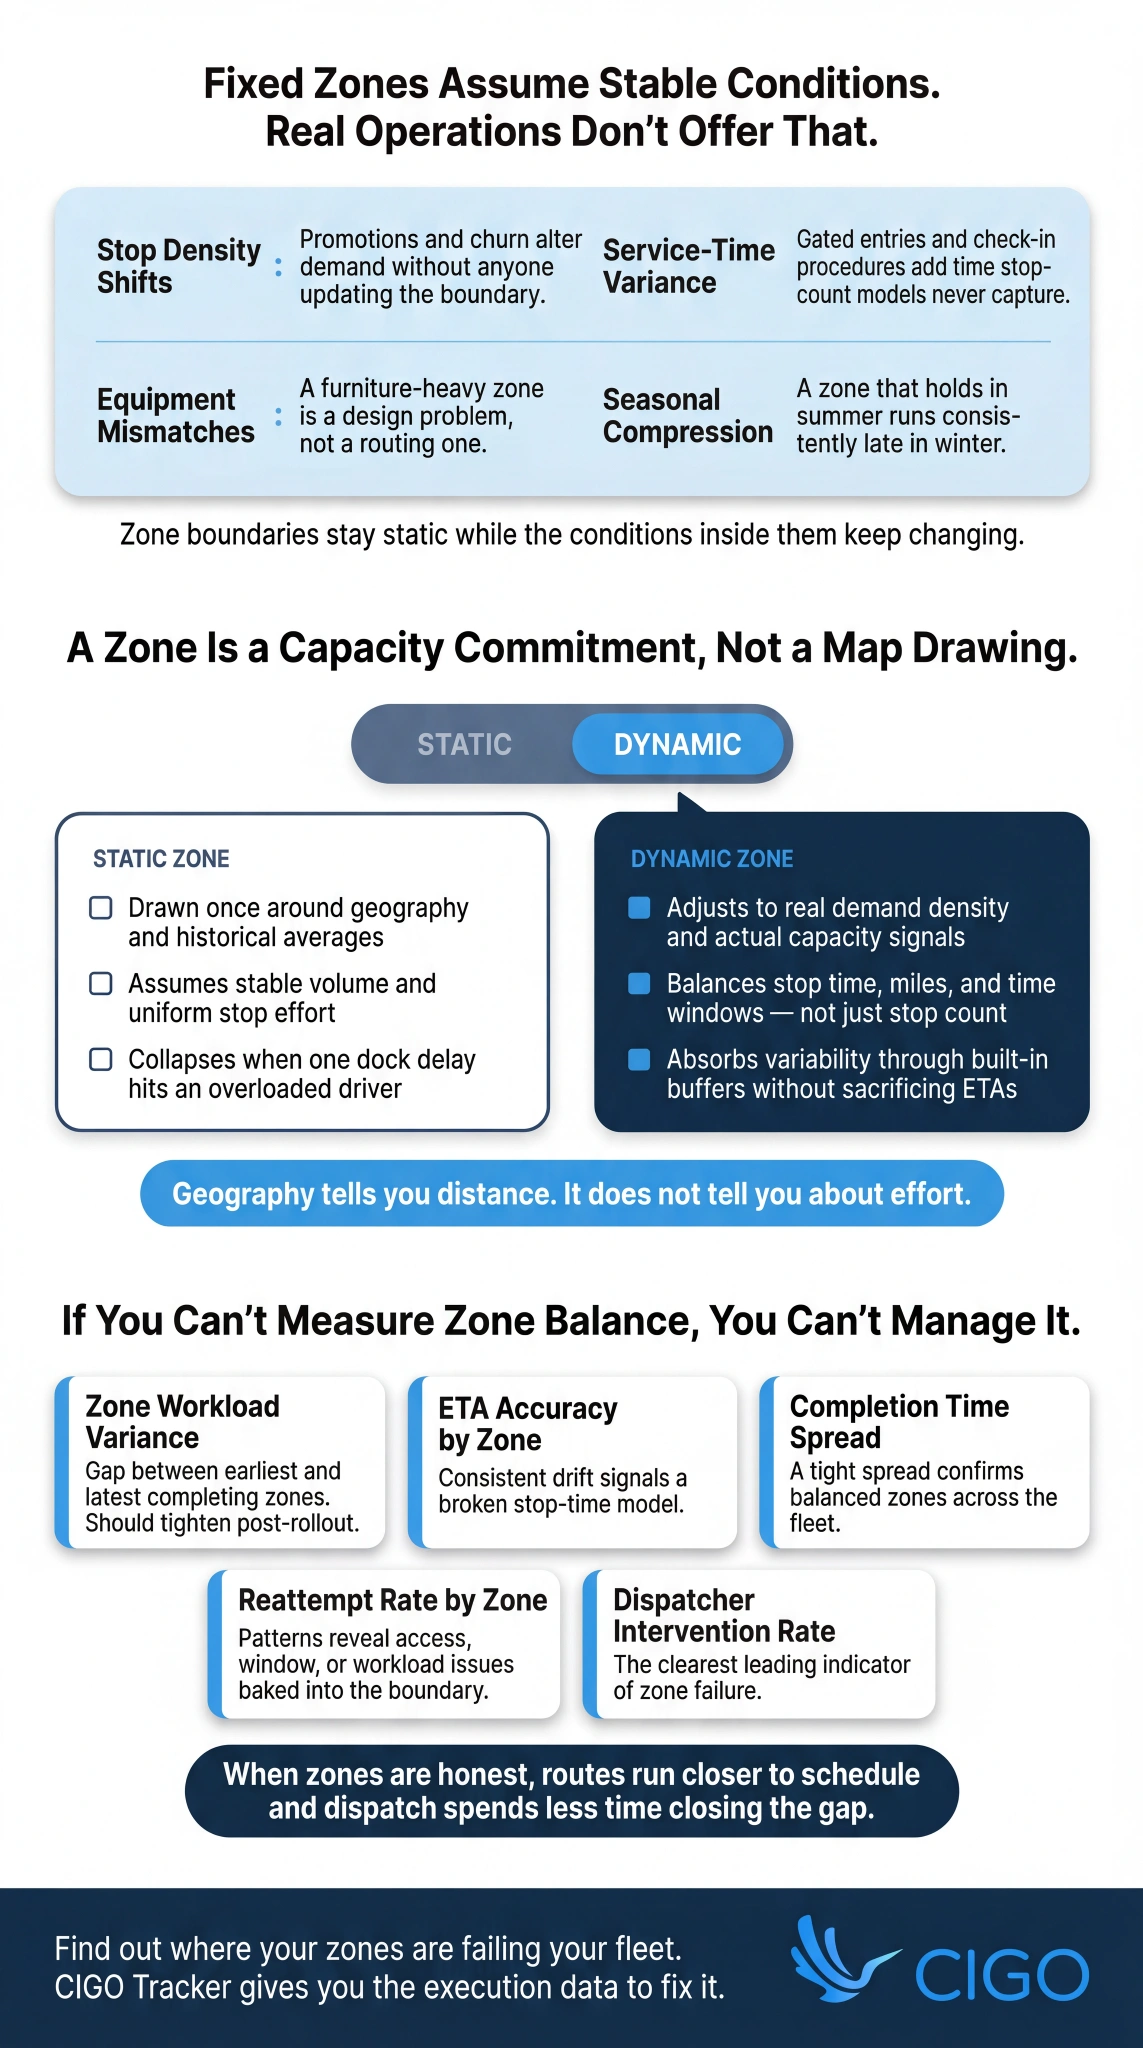
Static zones are drawn once, usually around geography and historical averages, and they hold until someone has time to redraw them. That rarely happens.
The core problem is that static zones assume stable volume and uniform stop effort, and neither assumption holds for long.
Dynamic zones, by contrast, adjust to real signals while maintaining enough operational stability that drivers are not relearning new territory every shift. The lesson is that zone design is not a one-time decision. It is an ongoing input into how well capacity gets used.
Dynamic Zone Management vs. Routing Optimization
Routing and zone management are sequential, not interchangeable.
Zone management partitions work across the fleet first, then routing sequences stops efficiently within each zone. The distinction matters because a routing engine cannot fix a zone carrying 60% more stops than a driver can complete in a shift.
That fix has to happen upstream, in the zone design itself.
Understanding the difference between logistics and route optimization clarifies where zone management ends and routing begins, and why confusing the two leads to plans that look clean but fall apart in the field.
Why Fixed Delivery Zones Fail Under Real-World Conditions
Fixed zones fail because they assume stable volume and uniform stop effort, and neither holds for long.
PeerJ research on ETA prediction in logistics found that nearly 70% of consumers avoid repeat purchases after delayed deliveries, underscoring what poor ETA accuracy actually costs. Zone imbalance is one of the most consistent contributors to that gap.
When one driver’s zone carries more time-intensive stops than the shift allows, ETA accuracy collapses regardless of how cleanly the route is sequenced. Geography tells you distance. It does not tell you about effort.
The Hidden Drivers of Zone Imbalance
Zone imbalance rarely comes from one source. It builds up across several overlooked variables:
- Stop density shifts from promotions, seasonal swings, and customer churn alter demand without anyone updating zone boundaries.
- Service-time variance from gated apartments, call-ahead requirements, and check-in procedures adds time that stop-count models never capture.
- Equipment mismatches turn a furniture-heavy zone into a design problem, not a routing one.
- Seasonal time compression means a zone that works in summer can run consistently late in winter.
The lesson is that zone boundaries stay static while the conditions inside them keep changing.
What Imbalance Looks Like Operationally
Zone imbalance has a measurable cost.
Harvard Business Review research on failed delivery patterns found that up to 20% of packages aren’t delivered on the first attempt, with decentralized zones and reduced driver loads cutting failed attempts by up to 10% in dense urban areas.
The mechanism is straightforward: overloaded drivers rush stops, miss windows, and skip proof capture. Meanwhile, dispatch reassigns stops midday, creating status gaps and handoff errors.
Customer ETAs degrade because the notification sent two hours ago is already wrong. Imbalance doesn’t just slow the day down. It compounds into reattempt costs and service failures that show up in weekly KPIs.
How Dynamic Zone Management Improves Delivery Capacity Planning

The core shift is treating zones as a capacity instrument, not a map artifact. A zone is a commitment about how much work a specific team can execute in a given day.
When zones are designed with that frame, the plan is honest from the start.
OR Spectrum research on dynamic service area sizing confirms that demand-driven zone boundaries consistently outperform static ones because they respond to the signal that matters most: whether demand density is within the fleet’s actual ability to execute on time.
Each planning cycle, the zones get sharper, and the compounding accuracy is where the real capacity gains come from.
Balancing Beyond Stops per Driver
Stop count is the most visible measure of zone balance, but it is also the least accurate. Real balance accounts for:
- Service time per stop
- Miles driven within the zone
- Time-window constraints
These factors interact with how stops are clustered and sequenced, which is why route density optimization for delivery profitability begins at the zone level, not the route level.
Zones built at 95% capacity collapse under a single dock delay or access issue. A 15 to 20% buffer absorbs that variability without sacrificing completion time. Building in margin is what makes efficiency sustainable.
Adapting to Volume Shifts Without Rebuilding Everything
Volume spikes do not require complete rezoning. Effective dynamic zone systems allow micro-adjustments that respond to demand without disrupting operational stability:
- Shifting a boundary to offload a dense cluster
- Merging underloaded zones when volume drops
- Splitting an oversized zone during a promotional peak
Stability rules prevent those adjustments from becoming daily disruptions by defining:
- Maximum boundary drift
- Preferred driver territories
- Frozen core areas that require approval before changing
The goal is not constant change; it is enough flexibility to stay accurate without undermining execution reliability.
Day-Of Recovery: Rezoning When Capacity Changes
When a truck goes down mid-morning, the question is not whether to redistribute the load.
It is how to redistribute it cleanly. Dynamic rezoning reallocates stops across adjacent zones based on current workload scoring, driver location, and remaining time windows.
A study by Transportation Research on dynamic order assignment and dispatching confirms that exception-triggered reoptimization, rather than manual intervention, is what keeps same-day recovery fast and accurate.
Proof and status discipline stay intact because the zone model maintains stop-to-driver relationships within the system, not through phone calls and notes. That consistency keeps customers informed and disputes manageable when plans change.
Key Features to Look For in a Dynamic Zone Management Tool
Not every platform that offers zone management is genuinely dynamic. The features below separate planning tools from capacity tools:
- Zone generation based on time windows, service time, miles per driver, and equipment requirements
- Configurable stability controls: boundary drift limits, preferred territories, and frozen core zones
- Capacity scoring per zone: workload estimate, risk score, and expected completion time
- What-if scenario planning for volume spikes, vehicle failures, or new depot locations
- Audit trails with approval requirements for changes that exceed drift thresholds
- Performance reporting by zone: utilization rate, on-time performance, and reattempt rate
Zone management rarely works in isolation. Choosing the right logistics optimization software starts with understanding how a planning layer fits within the tools already running your operation.
What Data Makes Dynamic Zones Actually Work
Dynamic zone management is only as accurate as the data behind it. The priority before deploying any dynamic zone tool is assembling honest data, not complete data.
Historical stop-time and dwell patterns reveal which zones consistently run long. Order density trends tell the model when workload is about to shift before it happens.
Exception and failure reasons mapped to geography are equally valuable: when access issues and refused deliveries are tagged by location, patterns emerge that zone boundaries can then account for. Better data makes the plan defensible when things go wrong.
Start Simple, Then Add Precision
The most common implementation mistake is trying to model everything at once. Instead, build in stages:
- Start with stop count, miles, and basic time windows
- Add service-time weighting once the operation trusts the model
- Layer in exception pattern overlays after data quality is validated
Each stage surfaces new imbalances while giving dispatch time to adapt. The sequencing matters because confidence in the system has to grow alongside its complexity. Rushing to full precision before the basics are stable is how implementations stall.
Best-Fit Use Cases
High-Volume Last-Mile Fleets
For high-volume last-mile operations, daily volume shifts make static zones a reliable source of overload. A promotion might push 40% more stops into a single neighborhood, while a new commercial client can add heavy deliveries to a zone calibrated for residential speed.
Because of this, Parcel and Postal Technology International reports that each failed delivery costs approximately $17.20 per parcel in the U.S., and overloaded zones are a consistent driver of first-attempt failure.
Dynamic zone balancing addresses the problem at the planning layer before it surfaces in execution.
Mixed Stop Types and Service-Time Variability
When a single fleet serves retail, residential, and job-site deliveries in the same day, zone balance by geography becomes almost meaningless.
A retail stop might take 10 minutes, a residential apartment with an elevator and signature requirement might take 25, and a job-site delivery with staging might take 45.
Zones need to account for stop effort, not distance. How stop type variation feeds into zone design is one of the core problems that delivery driver management software for mixed fleets is built to solve.
Multi-Depot or Wide Coverage Areas
For operations running from multiple depots, zone boundaries need to align with starting positions as much as with demand density.
Dynamic rezoning in these environments delivers consistent benefits:
- Zones closer to depot B belong to depot B, regardless of historical convention
- Deadhead miles drop when depot-to-zone alignment reflects actual starting positions
- Seasonal demand shifts and new client locations trigger planned rebalancing, not reactive scrambles
Depot placement and zone design are connected decisions, not separate ones. That relationship sits at the center of building a resilient last-mile delivery strategy and shapes how well zone boundaries hold as coverage areas expand.
Implementation Best Practices

Before configuring a single rule, define what balanced means for your operation. Without it, the software defaults to assumptions that may not match your priorities. From there:
- Set stability rules first: boundary drift limits, preferred territories, and approval requirements
- Pilot in one metro area with measurable baselines
- Train dispatch on rezoning triggers and intervention thresholds
Clarity on that decision boundary prevents over-reliance and the manual overrides that defeat the tool’s purpose.
Common Mistakes to Avoid
Even well-intentioned implementations break down in predictable ways, and most share the same root cause: optimizing for the wrong variable.
Redrawing zones daily without stability controls creates driver confusion and erodes the familiarity that speeds up service times. Using zip codes as zones substitutes postal constructs for real inputs like stop-level service time, demand density, and fleet capacity.
Balancing by stop count alone recreates the core problem under a new label. A balanced completion time is the goal, not a balanced stop count. Any zone model that skips service-time estimates is a marginally better version of what you already have, not a genuine planning upgrade.
KPIs to Track After Rollout
The KPIs that validate dynamic zone performance connect zone design to execution outcomes.
Tracking them consistently separates a model that improves over time from one that drifts back to imbalance. These metrics overlap closely with top KPIs for last-mile delivery performance measurement, making them worth establishing as baselines before go-live rather than after.
Focus on:
- Zone workload variance: gap between earliest and latest completing zones
- ETA accuracy by zone: consistent drift signals a broken stop-time model
- Route completion time spread: a tight spread confirms balanced zones
- Reattempt rate by zone: patterns reveal access, window, or workload issues
- Dispatcher intervention rate: the clearest leading indicator of zone failure
How CIGO Tracker Supports Dynamic Zone Planning
CIGO Tracker closes the feedback loop between what the plan assumes and what execution delivers. Real-time delivery tracking surfaces exception patterns and stop-time actuals by location before they become service failures.
The Planner translates that data into zone adjustments grounded in what the fleet can actually execute. Logistics optimization then sequences stops within those zones efficiently, while SOC 2-compliant security ensures that the execution data feeding the zone model remains protected and audit-ready.
Together, these capabilities turn zone management from a planning assumption into a continuously calibrated system.
Future Trends in Dynamic Zone Management
Zone management is moving from reactive to predictive.
Rather than adjusting zones in response to the current day, future systems will generate recommendations based on early signals: order intake rates, historical day-of-week patterns, and driver availability at shift start.
Emerald Publishing’s hybrid ML research found a 20.7% time efficiency improvement when temporal and spatial models are integrated. As training data matures, predictive zone modeling will increasingly deliver gains at that scale.
The operations that build clean execution data now will be best positioned to benefit.
Are Your Zone Boundaries Honest Enough to Hold Under Pressure?

Zones are capacity commitments, not map drawings. When boundaries reflect what your fleet can actually execute, routes run closer to schedule, ETAs hold, and dispatch spends less time closing the gap between plan and reality.
Start by mapping where zones consistently fail. Those patterns tell you exactly where to pilot a dynamic approach. CIGO Tracker is built to support that process from day one. Start a free trial or contact the team to get started.
FAQs
What is a dynamic zone management system in last-mile delivery?
A dynamic zone management system builds and updates delivery zone boundaries based on real demand density, available capacity, and execution data rather than fixed geographic lines. The goal is to make zones a live capacity instrument so workload distribution stays fair and ETAs stay accurate.
How is a dynamic zone management tool different from routing software?
A dynamic zone management tool decides how work is partitioned across the fleet. Routing software sequences stops within those zones. Zone management is the upstream decision. When zones are imbalanced, no routing algorithm can fix the overload that follows.
How often should delivery zones change to stay effective?
Rezoning frequency depends on volume volatility. High-volume fleets may need weekly boundary adjustments, while stable operations may only require quarterly reviews. More important than the schedule is exception-trigger logic: zones should update when performance data warrants it, not on a fixed calendar.
What data is required to build dynamic delivery zones?
A dynamic zone management system needs historical stop-time patterns, order density trends, time-window rules by customer type, and geographically tagged exception data. Data quality matters more than completeness. Zones built on actual service-time data hold up under real conditions far better than those built on estimates.
Which KPIs prove dynamic zones are working?
Track zone workload variance, ETA accuracy by zone, route completion time spread, reattempt rate, and dispatcher intervention frequency. When the dynamic zone management tool is working, completion times tighten, dispatch intervenes less, and first-attempt success improves in previously overloaded zones.