Two drivers leave the same depot on the same morning. One completes 25 stops and turns a profit. The other finishes one and costs your fleet more than the delivery was worth.
That’s not a driver problem. It’s a density problem. And most fleets never see it because single-stop losses disappear inside blended averages that make route-level economics look healthier than they are.
Maximizing fleet profitability starts with fixing that structure. Route sequence optimization won’t save a low-density run. What actually moves the needle is demand aggregation, zone redesign, and visibility tools like CIGO Tracker that surface the problem before your margins collapse.
Key Takeaways
- Low-density routes push cost per stop delivery high enough to erase fleet profitability.
- Maximizing fleet profitability means managing route density, not just total order volume.
- Demand aggregation, zone consolidation, and time-window negotiation are your biggest levers.
- Route optimization sequences stops efficiently but cannot create density where none exists.
- Track stops per mile last mile, cost per stop, and revenue per route.
What Is Fleet Profitability and Why Routes Control It?
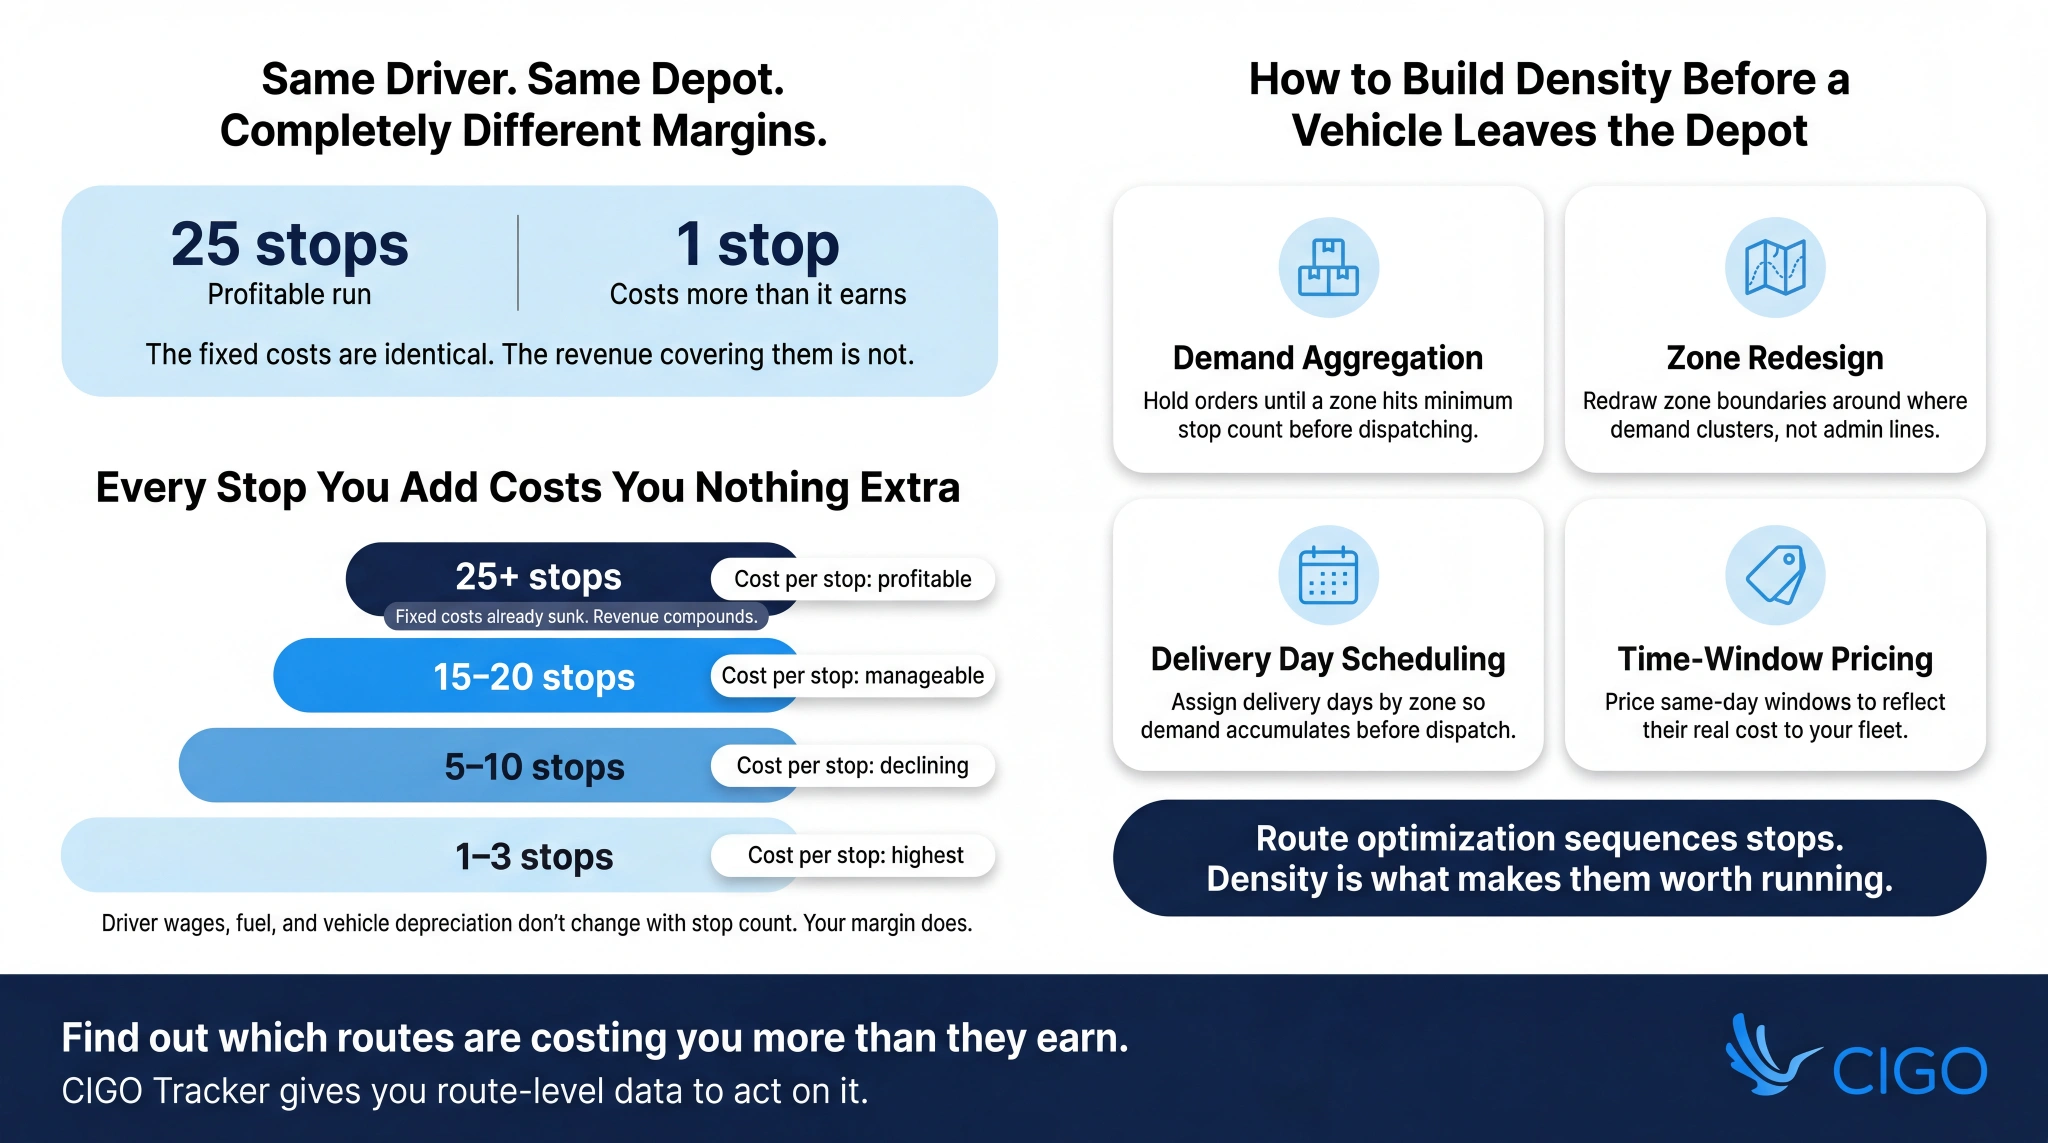
Fleet profitability is the margin your route generates after accounting for driver wages, fuel, vehicle depreciation, and overhead. Understanding it starts with one key insight: most of those costs are fixed the moment your vehicle leaves the depot.
Your driver is paid for the full shift regardless of stop count. Fuel to exit and return is spent before the first delivery, and vehicle depreciation accrues by time and mileage, not productivity.
Because of that, every additional stop you add improves route economics without adding proportional cost. Fixed costs are already sunk, so more stops mean more revenue spread across the same base.
That’s precisely why route density and profitability are inseparable. The routes costing you the most aren’t always the longest. They’re the emptiest.
The Cost Components of Every Delivery Route
Every route carries two cost layers, and knowing the difference changes how you plan.
Fixed costs hit the moment your vehicle leaves the depot: driver wages, base fuel, vehicle depreciation, and overhead. These are unavoidable regardless of stop count. Variable costs, including inter-stop fuel, service time, and dwell time, stack on top of that foundation.
According to MIT Sloan Management Review, last-mile expenses can account for up to 53% of total supply chain costs. Since labour is essentially fixed per shift, adding more stops spreads that dominant cost across more revenue-generating deliveries, which is exactly where your margin improves.
Why Last-Mile Profitability Is So Sensitive to Stop Count
A 30-stop route and a 3-stop route can carry nearly identical fixed costs. But one generates 10 times the revenue from the same asset and driver. That asymmetry is exactly why stop count hits your margins so disproportionately hard.
The proof is in the numbers. By densifying its last-mile routes and increasing stops per run, Walmart reduced its store-to-home delivery costs by 20% in a single year. Same drivers, same vehicles, just more stops per route spreading fixed costs across more revenue.
That’s the density advantage, and it’s available to any fleet willing to plan for it.
What Makes a Single-Stop Route So Expensive?
A single-stop route uses a full driver shift and a full vehicle for just one delivery. The fixed costs are identical to a 30-stop run, but the revenue covering them is a fraction of the size.
That imbalance is where losses compound. When your cost per stop delivery runs five to fifteen times the fleet average, thin margins don’t just shrink. They disappear entirely, and that route ends up costing you more than the delivery was ever worth.
Fixed Costs That Do Not Scale With Stop Count
Every single-stop route carries the same cost structure as a full route, and none of it adjusts when stop count drops:
- Driver shift wages billed for the full shift, whether one stop or twenty are completed
- Vehicle depreciation and maintenance accruing by time and mileage, not by productivity
- Depot and administration overhead allocated per route deployment, not per stop
- Minimum fuel cost for depot exit and return, regardless of stop count
These costs don’t scale down with a lighter load. They sit fixed, absorbing revenue that was never there to cover them.
The Windshield Time Problem
Windshield time is the share of a driver’s shift spent travelling between stops rather than delivering. On a high-density urban route, that figure typically sits around 30% to 40%. On a single-stop route, it can exceed 80%.
That distinction matters more than most fleets realize.
Every minute your driver spends behind the wheel between stops is a labour cost with no delivery attached to it. So when your routes are thin, you’re not just covering fewer stops.
You’re paying full shift wages for a driver who is spending most of their day driving to work that isn’t there.
How Sparse Routes Hide Their True Cost
Averaged metrics are where sparse route losses go to hide. A 25-stop urban route running at $8 per stop blends into the same report as a 3-stop suburban run at $40 per stop, and neither number triggers an alert.
As G10 Fulfillment’s logistics benchmarking research puts it, a blended benchmark will always point you toward the wrong conclusion.
Without route-level profitability reporting, sparse runs get quietly justified as relationship deliveries or emergency fulfilment. The actual cost never reaches a decision-maker, and the losses keep compounding.
How to Identify Unprofitable Routes in Your Fleet
That means calculating cost per stop delivery and revenue per stop for every route, every day, then ranking them from worst to best. The bottom of that list tells you exactly where your stops per mile last mile metric is collapsing.
Find the lowest-performing 10% and treat those as your first consolidation targets. That’s where the losses are concentrated, and that’s where the structural work begins.
Stops-Per-Mile and Stops-Per-Hour as Profit Signals
Two metrics tell you more about route profitability than almost anything else: stops per mile and stops per hour.
Stops per mile measures density, specifically how many productive deliveries your fleet generates per mile driven.
Stops per hour measures labour efficiency, capturing how many stops a driver completes each hour after accounting for dwell time and windshield time. Together, they give you a clear, route-level picture of where margin is being made and where it isn’t.
Set benchmarks for both by route type, urban, suburban, or rural, and treat any route falling more than 20 percent below benchmark as a consolidation candidate.
Cost-Per-Stop Analysis: What to Look For
Cost-per-stop analysis comes down to a single comparison: what each stop costs you versus what it earns you.
For every route, calculate driver wage plus fuel plus variable costs, then divide by stops completed. That’s your cost per stop delivery. Compare it against revenue per stop on the same run, and the picture becomes clear quickly. Any route where cost exceeds revenue is losing money on every delivery, not just underperforming.
Once you have that figure, segment it by zone, day of week, customer type, and stop type. That breakdown is where the real consolidation opportunity reveals itself.
Red Flag Patterns That Signal a Route Consolidation Problem
Some patterns are almost universally symptomatic of a density problem, and spotting them early is what separates reactive fleets from profitable ones:
- Routes with fewer than five stops in urban or suburban zones
- Same-day emergency routes added after the main planning window closes
- Routes serving a single customer on a recurring basis without batching adjacent demand
- Zones with strong stop counts midweek but very thin counts at the start of the week
How to Maximise Fleet Profitability by Eliminating Single-Stop Routes

The core principle is straightforward: every stop added to a route improves profitability because the fixed costs are already sunk. That’s why eliminating single-stop routes isn’t just an operational preference. It’s the most direct lever you have for maximising fleet profitability.
The strategic tools that make it possible are demand aggregation, zone consolidation,
time-window negotiation, and minimum-stop-count policies.
Stop Clustering and Route Density Optimisation
Start by mapping your stop locations and identifying demand clusters that are currently being split across multiple low-density routes.
That fragmentation is where density collapses and costs climb.
Clustering is a pre-routing decision, which means it happens before any optimization software gets involved.
Understanding how route optimization works matters, but no tool can create density that wasn’t planned for. Redraw your zone boundaries around natural demand clusters, consolidate scattered stops into routes that hit your stops-per-mile target, and verify that each consolidated route is executable within driver hours.
Demand Aggregation and Order Batching
Consolidating orders before dispatch is one of the most reliable ways to build route density before a vehicle ever leaves the depot.
Research from the University of Arkansas Supply Chain Research Program confirms that consolidating orders through batching creates meaningful delivery density efficiencies. In practice, that means three tactics:
- Temporal batching: hold orders for a zone until a minimum stop-count threshold is met before dispatching
- Geographic batching: assign delivery days to zones so demand accumulates rather than triggering a vehicle per order
- Minimum stop-count policies: set a floor, for example no vehicle leaves for fewer than 8 stops in urban zones, with a documented exception process for urgent runs
Zone Redesign to Consolidate Sparse Runs
Sparse zones aren’t a routing problem. They’re a boundary problem. When zones follow administrative lines rather than demand clusters, low stop counts are baked into every run before dispatch opens.
Redraw boundaries around where demand actually concentrates, then merge under-dense zones with adjacent areas until each supports a full route. Without that structural fix, even a well-built last-mile strategy hits a ceiling. You can’t sequence your way out of a zone designed wrong.
Customer Time-Window Negotiation to Enable Consolidation
Most single-stop routes aren’t a demand problem. They’re a promise problem.
Any-day delivery windows force low-density dispatching because every customer expects a vehicle on their schedule, not yours.
The fix is commercial, not operational. Offer structured delivery days by zone: “Your area runs Tuesday and Friday; which works better?”
Price same-day windows to reflect what they actually cost. When customers see the real cost of isolation, flexibility becomes the easier choice, and consolidation becomes possible.
Key Features of Route Optimisation Software for Fleet Profitability
Route-level profitability cannot be managed without the right data layer. When evaluating tools built to cut costs and boost route optimization efficiency, these capabilities directly support density management:
- Route-level profitability reporting: cost per stop, revenue per stop, and margin by route
- Stop density analytics: stops per mile and stops per hour by route, zone, and driver
- Demand aggregation tools: order batching by zone and delivery day with minimum stop-count thresholds
- Zone performance dashboards: cost per stop and utilization rate by zone
- Scenario modelling: test the profitability impact of zone consolidation before committing
- Minimum stop-count enforcement and exception workflows to block low-density dispatching at the source
Implementation Best Practices
- Start with data: build your cost-per-stop and stops-per-mile report for the last 90 days before making any operational changes. Identify your worst 10% of routes by profitability first.
- Introduce batching in your lowest-demand zones first: operational disruption is minimal and profitability gains are immediate.
- Frame delivery day changes commercially: tell customers it means a dedicated, fully-loaded driver for their zone. Reliability messaging reduces friction before window fees enter the conversation.
- Make minimum stop-count policy your default: vehicles shouldn’t leave your depot below threshold. Build the exception process, not the other way around.
KPIs to Track Fleet Profitability After Consolidation
Once consolidation is underway, the right metrics confirm whether the structural work is paying off. Tracking the top KPIs for last-mile delivery performance gives you a full picture across both density and cost dimensions:
- Stops per mile by route and zone: the primary density signal, should climb post-consolidation
- Cost per stop delivery: compare against pre-consolidation baseline to confirm improvement
- Windshield time percentage: target below 40 percent in urban zones
- Single-stop route rate: should decline week over week
- Exception rate on stop-count policy: how often the batching floor is overridden and why
Recalculate benchmarks quarterly as costs shift.
How CIGO Tracker Helps Maximise Fleet Profitability
CIGO Tracker’s delivery tracking captures actual stop times, dwell duration, and inter-stop drive time at route level, giving you the ground truth cost-per-stop calculation depends on. That same data surfaces real windshield time visibility, exposing the density problems fleet-wide averages routinely conceal.
Exception and failure data by route identifies which stops, zones, or time windows are consistently forcing low-density dispatching. Combined with fleet route analytics and logistics optimisation tools, that evidence gives planners what they need to fix the problem structurally, not just flag it.
Future Trends in Fleet Profitability Optimisation
Fleet profitability tools are shifting from descriptive to prescriptive. Penske’s 2025 Transportation Leaders Survey found 97% of logistics leaders now consider real-time benchmarking essential, and 70% have already adopted AI solutions to act on it.
Three developments define where this is heading. AI-powered demand aggregation will replace fixed holding windows with adaptive dispatch timing based on live zone density.
Profitability-aware routing engines will optimize explicitly for margin per route, not just distance. Dynamic density pricing will make the real cost of isolated windows visible in real time.
Are Your Routes Actually Profitable, or Just Completed?
Single-stop routes are a structural problem. Optimizing their sequence doesn’t fix them. Density does.
Run a cost-per-stop analysis for the last 90 days, identify your bottom 10%, and launch a 30-day aggregation pilot in those zones. CIGO Tracker gives you the route-level data to do that work with precision.
Start a free trial or contact the team to get started.
FAQs
What is route density and why does it affect fleet profitability?
Route density measures how many stops are completed per mile driven. Higher density spreads fixed vehicle and driver costs across more deliveries, directly lowering cost per stop delivery and improving fleet profitability across every route you operate.
How do I calculate cost-per-stop for my fleet?
Add driver wages, fuel, and variable route costs, then divide by total stops completed. Compare the result to revenue per stop. Routes where cost per stop delivery exceeds revenue are operating at a loss on every delivery made.
What is demand aggregation in last-mile delivery?
Demand aggregation is batching compatible orders before dispatching a vehicle, holding them until a minimum stop-count threshold is reached. It improves route density, reduces windshield time, and eliminates the unprofitable single-stop runs that consistently erode fleet profitability.
How do I eliminate single-stop routes without alienating customers?
Offer zone-based delivery days with flexible scheduling, and reserve same-day windows for a premium price that reflects the real cost. Most customers accept flexibility when framed around reliability, making fleet profitability improvements commercially sustainable over time.
What KPIs should I track to measure fleet profitability improvement?
Track stops per mile, cost per stop delivery, windshield time percentage, vehicle utilization rate, and revenue per route. Together these KPIs reveal whether consolidation is genuinely improving fleet profitability or simply redistributing costs across different routes.